

Inflation shocks with real impact


High inflation rates have dominated headlines in Belgium for a while now. To better understand the recent rise in inflation rates and its impact on the economy, we identified positive demand and negative supply shocks in the Belgian economy based on a BVAR model. This model shows that both economic shocks have been particularly large in recent years and that the negative supply shocks that have recently plagued the Belgian economy, including the problems in the global supply chain and the energy crisis, are having a negative impact on real consumption despite automatic wage indexation.
We also looked at how inflation may differ for individual households by calculating inflation by income quartile. This analysis shows that households in the lowest income quartile, who typically spend a higher percentage of their income on energy, currently face higher inflation than households in the highest income quartile.
Demand and supply shocks pushing up inflation
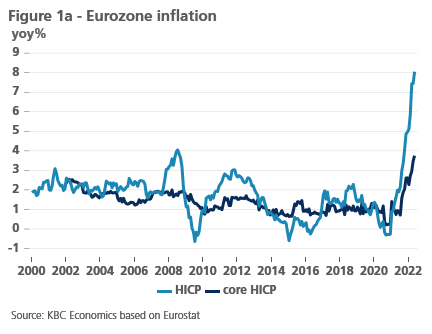
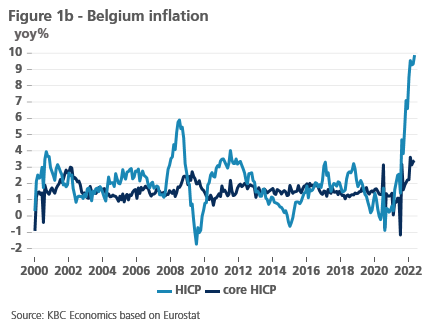
Inflation remains at very high levels. Month after month, existing inflation records were broken, both in the US and in Europe. And even as the first tentative signs of an inflation slowdown are appearing, inflation continues to seep into a growing number of goods and services, both within and outside the eurozone. These persistent inflationary pressures have many causes: the consumer demand recovery after COVID-19, global supply chain issues, the energy crisis... Positive demand and negative supply shocks reinforced each other and led to a surge in inflation in almost all Western economies. For example, inflation in the eurozone rose from -0.3% at the end of 2020 to 8.1% in May 2022. Remarkably, energy - especially in Belgium and the eurozone - remains one of the main factors - but not the only one - in that inflation surge (see Figure 1a and 1b). And the energy crisis (supply shock) starting in the fall of 2021 plays a leading role in it.
Inflation above the danger threshold?
Such abrupt reversal in inflation trend and the series of new inflation records are not without consequences. Persistently high inflation does have costs, including in the form of greater uncertainty regarding general and relative prices and the impact of macroeconomic uncertainty on (the composition of) investment and thus possibly economic growth. But at what level inflation actually starts to "bite" and becomes truly harmful to the economy remains a great unknown. Most economists assume that moderate inflation (say 2%) is necessary to keep the economy running. It not only represents the trend increase in quality of consumer goods and services, but also introduces a minimum of much-needed flexibility into the nominally-rigid Western economies.
Just where that tipping point from which the harmful effects of inflation become dominant lies, however, remains an open question. A number of economists have cautiously put forward estimates for the inflation reversal rate. Blanchard et al (2010)[1] argue that the negative impact of inflation below 10% is difficult to identify and assess. More recent econometric studies, based on threshold regression models (cf. Kremer et al (2013)[2]), put the limit at around 5% for industrialized countries and 17% for developing countries. Irrespective of the exact inflation threshold one uses or believes in, the risk of (permanent?) damage does increase sharply in high inflation environments or high inflation uncertainty...
Demand versus supply shocks
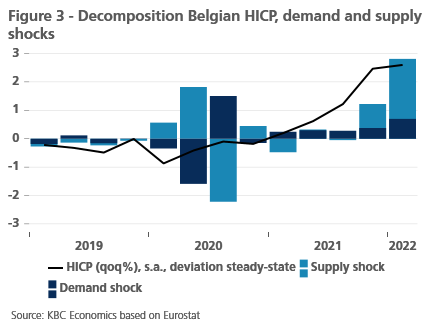
Moreover, inflation itself is not necessarily the right yardstick to measure economic impact and or to read the damage. After all, inflation itself is the result of a wide variety of underlying shocks. And the impact on the economy differs across shocks (also depending on the institutional framework and economic structure also from economy to economy). For example, there is a substantial difference between inflation arising from a (positive) demand shock or from a (negative) supply shock. A positive demand shock will lead to higher inflation and higher consumption, while a negative supply shock will lead to higher inflation and lower consumption. Both types of shocks have had a significant impact on the economy in recent years. Both demand and supply shocks have been particularly large and unusually frequent (Figure 2a and 2b, Belgian Economy).
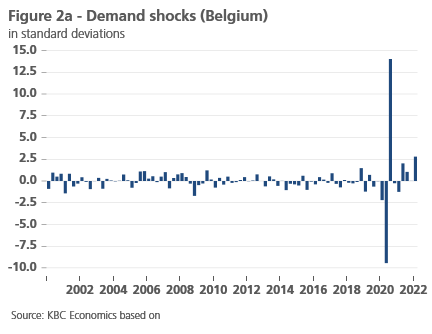
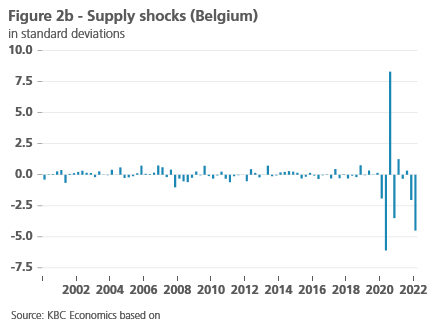
Figure 3 shows the impact of both shocks on Belgian inflation (HICP) (more precisely, the median effects per shock per quarter, and since these do not have to be consistent with each other, Figure 3 should rather be viewed as an illustration of the interplay between demand and supply shocks).
Wage indexation does not provide inflation immunity
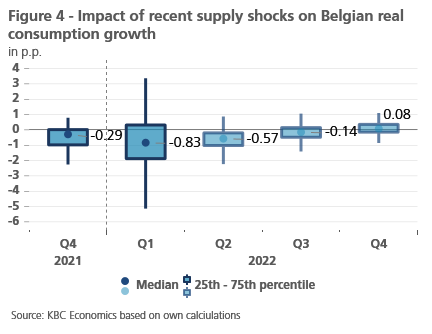
Supply shocks are the most important factor driving the recent inflation wave. And consequently, the rising inflation signals are not innocent. Despite automatic wage indexation, we expect these new supply shocks to have a negative impact on the Belgian economy. Exactly how strong that impact will be is difficult to quantify. But based on a BVAR model calibrated on historical series (and therefore also on past inflation waves), it appears that on average this impact is substantial. Figure 4 shows the impact of the recent negative supply shocks on real consumption growth. Without these negative supply shocks, consumption would have been 0.83 percentage points higher in the first quarter of this year (median estimate).
Negative supply shocks create a persistent inflationary upswing, which - despite automatic wage indexation - also translates into a persistent decline in consumer confidence. The corrective effects of wage indexation can be seen in real wages, which after a brief temporary decline, return to level relatively quickly. But despite that recovery, real consumption (as well as GDP and consumer confidence) remains impaired for longer.
It must also be remembered that wage indexation is based on an inflation rate for an average consumption pattern. Households that spend a higher percentage of their budget on, for example, energy, faced de facto higher inflation than those that only have to spend a small percentage of their budget. To illustrate this, Figure 5 depicts the implied price level paths of consumption baskets for the different income quartiles of households since 2020.
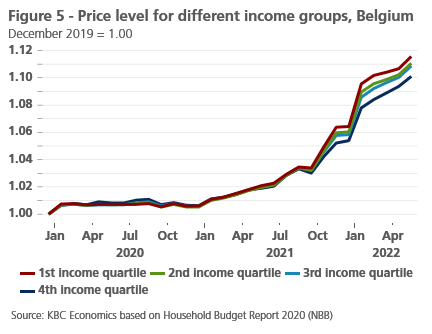
The calculations in this figure are based on the 2020 household budget survey (NBB). The consumption patterns of the different income quartiles were not updated for 2021 and 2022. Results should therefore be considered indicative.
Households that are part of the lowest income quartile - where energy expenditures constitute a larger-than-average part in spending - thus faced the highest price increases in their consumption basket. Thus, wage indexation based on average inflation does not fully compensate for the increase in the specific consumption basket. On the other hand, these households will then gain more (in real terms) when energy inflation falls below average inflation. That said, for some households - with binding budget constraints - the recent energy shocks have weighed on their consumption, especially given that some households cannot rely on sufficiently large savings buffers and that indexation is only applied with some delay. We note here that these figures do not take into account the various measures, including some specifically aimed at low-income families, that the government has taken to mitigate the impact of increased energy prices on families.
Conclusion
Supply shocks are therefore certainly not innocent, and their impact on the economy will continue for some time, both on inflation and on consumption. Moreover, inflation and associated economic costs could remain high if the energy crisis drags on longer than expected and raw material shortages or problems in the global supply chain persist. Meanwhile, given the war in Ukraine, rising food prices are more of a certainty than a risk scenario. Wage indexation and savings buffers built up before and during the pandemic obviously mitigate somewhat the impact on consumption for many households, but do not prevent the current situation from becoming more and more problematic for some households.
[1] O. Blanchard, G. Dell’Ariccia and P. Mauro (2010), “Rethinking Macroeocnomic Policy”, IMF WP SPN/10/03.
[2] S. Kremer, A. Bick and D. Nautz (2013), “Inflation and growth: new evidence from a dynamic panel threshold analysis”, Empirical Economics, 44: 861–878.