

ECONOMIC POLICY IN BELGIUM (1960–2021)
Correcting stubborn imbalances

- 1. Introduction
- 2. Economic policyprior to the financial crisis (1960–2007)
- 3. Economic policy during the financial crisis (2008–2014)
- 4. Economic policy takes new turn (2015–2019)
- 5 Economic policy during the Covid-19 crisis (2020–2021)
- 6. Future challenges remain substantial
For the pdf version, click here

Abstract
Three stubborn problems have been an almost constant focus of attention: a deterioration in the competitive position of businesses, a low workforce participation rate and unbalanced public finances. The second oil crisis in 1979 led to a reversal in the Keynesian economic policy of the 1960s and 1970s, which gave way to a consistent policy of export-led growth and more orthodox public finances. The recovery policy in the 1980s was followed by new measures relating to the goal of steering Belgium into the European Monetary Union (EMU) in 1999. Belgian economic policy during the 2008–2012 financial crisis continued to focus on supporting domestic consumption to a greater extent than in most other euro countries, which reduced the sense of urgency for structural reforms. Only in 2013 – particularly after the government of Charles Michel took office at the end of 2014 – did the political emphasis shift towards strengthening the supply side of the economy. These efforts centred on improving Belgium’s competitive position via wage moderation, pension reform, a series of budget cuts and a tax shift to fund a reduction in labour taxes. The recent Covid pandemic shifted the political focus towards managing the health crisis and mitigating its socioeconomic consequences. A recovery policy has nevertheless been shaped in the meantime, which will be supported in part by European resources. The practical implementation of this policy will be crucial in the years ahead to addressing the persistently large challenges facing the Belgian economy. These relate primarily to boosting long-term growth potential, safeguarding competitiveness, ratcheting up the workforce participation rate and securing the long-term sustainability of the public finances.
1. 1. Introduction
The ultimate goal of economic policy is to promote the well-being of as many citizens as possible. Opinions differ, however, as to what this general objective entails in practical terms. After all, well-being is a wide-ranging concept, which relates not only to material prosperity but also to personal development and equal opportunities, due care for the environment, and so on, making it harder to delineate the precise, concrete objective of economic policy. Viewed in the round, this objective is sometimes equated with the pursuit of a satisfactory rate of ‘sustainable’ economic growth – that is to say, growth that does not occur at the expense of the well-being of future generations (due to predatory exploitation of the environment, for instance) or that is accompanied by a fair distribution of income and wealth within the population. From the macroeconomic perspective adopted in this report, however, the goal of ‘sustainable’ economic growth is taken to mean ‘balanced’ growth, in the sense of the absence of accumulating ‘imbalances’. The latter implies: (1) optimum utilisation of the labour supply (the lowest possible rate of unemployment and inactivity); (2) price stability (low inflation); (3) a stable balance of payments (no excessive current account deficit) and the associated preservation of international competitiveness; and (4) balanced public finances (essentially a sustainable public debt).
In this research report, we discuss the evolution of the economic policy pursued in Belgium since the 1960s. We focus on the policy efforts made to reduce various stubborn imbalances that have frequently plagued Belgium in the post-war decades. These relate primarily to a deterioration in business competitiveness, high unemployment and unbalanced public finances. The decades from 1960 until the financial crisis are dealt with together in Section 2. Special attention is then paid to the two more recent severe crises: the financial crisis (Section 3) and the Covid crisis (Section 5), which have amplified certain economic imbalances (particularly in respect of the public finances). Between these two crises, economic policy took a positive turn towards supporting the supply side of the economy (Section 4). The recovery policy to combat the economic consequences of the Covid pandemic represents a continuation of this. Its success is crucial as economic policy in Belgium struggles to this day with major challenges in terms of reducing or avoiding imbalances. The current situation is reviewed in the final part of this report (Section 6).
2. Economic policy prior to the financial crisis (1960–2007)
Golden 1960s followed by difficult 1970s
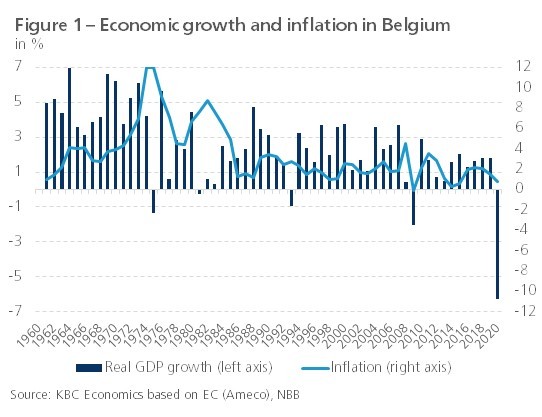
Like most other industrial countries, Belgium experienced a sharp improvement in living standards in the 1960s. The period between 1960 and 1974, when the first oil crisis struck, witnessed strong economic growth averaging 4.9% per annum (figure 1). Growth in these years was underpinned by a substantial investment drive. The government commissioned major infrastructure works, such as the building of motorways and social housing and harbour development including industrialisation in the Port of Antwerp. The expansion of its infrastructure, its central location, favourable industrial relations and ample availability of labour due to the young population, also enabled Belgium to take full advantage of the momentum towards European integration. The positive business climate led numerous multinationals to establish their European headquarters in the country. The Belgian economy was still fairly balanced during these first post-war years. Inflation was pushed up by wage pressure, but was not excessive. The public finances did not form a particular problem either. Government spending rose rapidly due to the expansion of infrastructure, the social security system and education, but its revenues also increased substantially on strong economic growth.
The economy was already showing signs of growing imbalances by the time the first oil crisis broke out in 1973, as manifested first and foremost in unrealistic wage-setting and a lack of budgetary discipline. The effects were amplified, however, by the oil crisis. Structural weaknesses were likewise revealed, including the relatively large proportion of obsolete, unprofitable sectors (most notably coal, steel and textiles). Even though the economy found itself in recession and had to contend with increasing unemployment, real wages continued to rise unhindered. The expansion of the social security system, the associated increase in contributions and automatic wage indexation caused labour costs to shoot up (figure 2), severely impeding the competitiveness of Belgian businesses. No relief was forthcoming from the exchange rate of the Belgian franc: the National Bank of Belgium repeatedly supported the currency through high interest rates. Corporate earnings and hence business investment shrank significantly in the face of higher labour and capital costs.
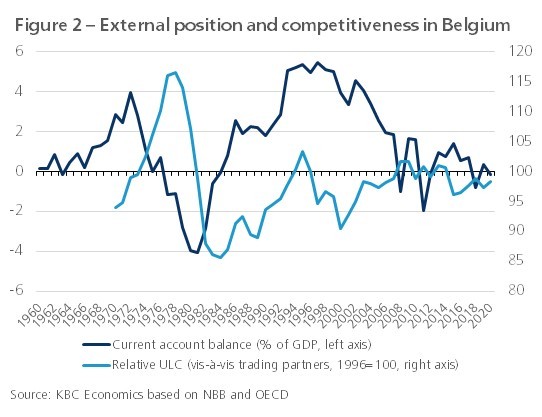
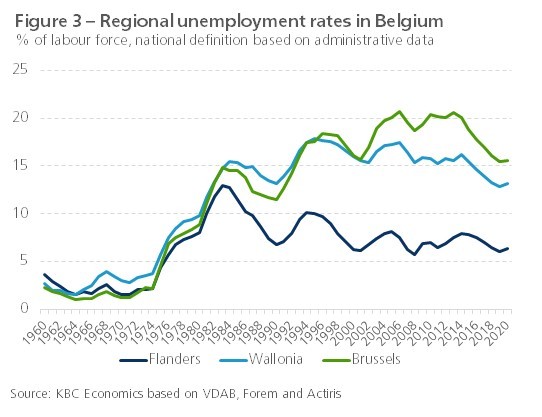
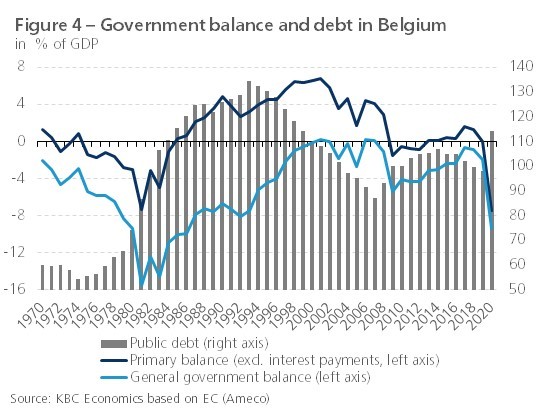
The loss of competitiveness and higher prices for imported energy products had a lasting impact. The balance-of-payments current account showed increasing deficits from 1977 onwards (figure 2) and inflation and unemployment rose sharply (figures 1 and 3). Convinced that the crisis was temporary in nature, the government responded by relaxing and expanding the unemployment benefit system and by stimulating public-sector employment. This, combined with the fall in government revenues, led in turn to a considerable deterioration in the public finances (figure 4). The second oil shock in 1979 and the global recession that accompanied it swiftly exacerbated the crisis situation. The external deficit and the budget deficit peaked in 1981 at 4.4% and 13.5% of GDP respectively. Confidence in the Belgian economy and currency was shattered.
Recovery policy in the 1980s
The government of Wilfried Martens, which took office in 1982, held out three approaches to tackling the accumulated imbalances: restored competitiveness, fiscal consolidation and the battle against unemployment. The first approach was pursued by means of special powers laws in which parliament was temporarily bypassed. In this way, the Belgian franc was devalued by 8.5% in 1982 against the other currencies of the then European Monetary System (EMS). Devaluation was accompanied by cost reductions (cuts in corporation tax and VAT on construction) and accompanying measures in the area of wage and price-setting (including a price freeze and the temporary suspension of automatic wage indexation). The Cooreman-De Clercq Act, which encouraged savers to invest in shares, was likewise part of the special powers policy. As far as the public finances and combating unemployment were concerned, the measures initially remained modest, with the government mostly gambling on the first policy approach to bring about improvements in these areas too.
It took the authorities a while to recognise that such secondary effects would not in themselves trigger any improvement in the public finances. A long-term budget consolidation programme then followed in 1984. This Saving Plan set out to reduce the deficit from 12% of GDP in 1984 to 7% in 1987, primarily by raising fresh revenues. One striking measure consisted of income moderation on the part of employees and benefit recipients in favour of the government, by skipping automatic index-linked increases. Having stood at over 6% at the beginning of the 1980s, the primary budget deficit (i.e. the deficit excluding interest charges) had turned into a primary surplus by 1985 (figure 4). Debt continued to rise, however, due to increasing interest charges (‘snowball effect’). A new recovery programme – the St Anne’s Plan, intended to continue the consolidation of public finances – was implemented in 1986. The emphasis in this instance was more on cutting expenditure, especially on social security and education, with the target of reducing the deficit to 7% of GDP pushed back until 1989.
Belgium succeeded from 1988 onwards in tapping into the economic boom the industrialised nations were experiencing at the time. This was followed by a first significant decline in the jobless rate (figure 3), although this remained above 7%, implying that a substantial structural element had crept into the unemployment figure. Corporate investment too was stimulated in this period by the favourable prospect of the completion of the European internal market (referred to by the shorthand of ‘1992’). Inflation remained modest due to low commodity prices (reverse oil shock) and moderate real wage growth trends. The Belgian central bank was able to reduce its policy rate significantly in this context. However, the good years were not used to consolidate the public finances, due to a political crisis and tensions surrounding constitutional reform. Business competitiveness did not move uniformly in the right direction, either. The balance-of-payments current account improved, but much of this was attributable to better terms of trade in the wake of the reverse oil shock of 1986.
Recognising the importance of keeping wage costs under control, the government passed the Law to safeguard national competitiveness in 1989, which tied wage developments in Belgium to those in the country’s most important trading partners. The Belgian franc was officially coupled to the Deutschmark, the strongest EMS currency, in June 1990 – a move that was part of a package of deregulation measures intended to modernise Belgium’s money and capital markets in preparation for ‘1992’. Withholding tax was reduced and the dual exchange market scrapped. Significant innovations included the issue of linear bonds and sovereign bonds open to the public (bonds were previously placed via a consortium of big banks). Yield spreads between Belgium and Germany narrowed drastically in the period following currency linkage, resulting in a significant decline in Belgian long rates.
The road to EMU followed by austerity fatigue
Belgium was still able to benefit in the early 1990s from the expansive effects of German reunification. The Bundesbank responded to the threat of German economic overheating and a deterioration in Germany’s external position by hiking its policy rate. The linkage of the Belgian franc with the Deutschmark obliged the NBB to follow the German interest-rate policy. A rapid change in climate subsequently meant that, as a small, open economy, Belgium was adversely affected by the sharp slowdown in growth that the global economy suffered from 1991 onwards (figure 1). Unemployment soared once more and the public finances deteriorated, partly because the interest snowball started to roll again (figures 3 and 4). The pace of wage growth also accelerated, despite the earlier law that had been passed to shield competitiveness. To make matters worse, the Belgian franc strengthened after sterling and the Italian lira left the EMS in 1992 and other currencies within the system were devalued. Expectation of fresh adjustments to the EMS triggered all sorts of speculative movements in 1993, now targeting the Belgian franc as well. The margins by which currencies were permitted to fluctuate within the EMS were widened, causing the franc to depreciate by 4% against the Deutschmark in the summer of 1993.
The government of Jean-Luc Dehaene presented new measures at the end of 1993 in its Global Plan, which formed part of the European consolidation policy imposed by the Maastricht Treaty to pave the way towards European Monetary Union. They included a youth employment plan, a freeze on real wages, the introduction of a ‘health index’ for wage indexation and a series of tax increases. The measures allowed considerable primary surpluses to be built up and government debt accordingly declined (figure 4). All the same, business competitiveness remained a point of concern, prompting the introduction in 1996 of a Law to promote employment and safeguard competitiveness. This law, which remains in place today, built on its 1989 predecessor by placing greater emphasis on prevention rather than cure. Specifically, it incorporates a wage standard designed to prevent Belgian wage costs from rising faster than those of the three neighbouring countries (Germany, the Netherlands and France).
This wage standard was far from universally observed in the years that followed the 1996 law, with both ex ante breaches in constituting the permissible wage increases and ex post breaches when evaluating them. As a result, the wage handicap that already existed on the law’s introduction continued to worsen until the first decade of the twenty-first century. Public finances did improve sharply in the second half of the 1990s, however, enabling Belgium to join the EMU in 1999 (figure 4). When a ‘purple’ coalition under Guy Verhofstadt came to power in 1999, a wide variety of ideological promises were made: the Liberal partners were committed to reducing the overall tax burden, while the Socialists promised to expand the welfare state. In practice, government spending rose significantly under the coalition and it was primarily the Socialists’ promises that were kept. This was made possible by a sharp reduction in interest charges (‘manna from heaven’). The economic conditions were generally favourable, but the government failed to use the good times to build up budget surpluses. Austerity fatigue meant that the primary government budget balance began to deteriorate once more after 1999 (figure 4).
3. Economic policy during the financial crisis (2008–2014)
Belgium during the banking crisis
Belgium’s extensive financial sector meant that the country was not immune to the financial crisis that afflicted Western economies from 2008 onwards. In 2007, prior to the crisis, the combined total assets of the three big Belgian banks – Fortis, Dexia and KBC – amounted to no less than 483% of Belgian GDP, with Fortis alone accounting for almost two thirds. Shortly after the collapse of Lehman Brothers, the crisis entered an acute phase in Belgium too. Belgium, the Netherlands and Luxembourg were forced to pump 11 billion euros into Fortis to keep it afloat after the bank’s share price came under pressure on doubts regarding its solvency. Its vulnerability related to structured funding assets held by the group and its health in the wake of the joint takeover of ABN AMRO by Fortis, Royal Bank of Scotland and Santander in late 2007. The capital injection failed to restore confidence in the bank and a rescue operation followed at the end of September, resulting in the sale of the Dutch activities (including the stake in ABN AMRO) to the Dutch government and the takeover of Fortis Bank Belgium by the Belgian government. The latter sold its 75% stake on to the French banking group BNP Paribas. The group’s remaining Belgian and international insurance activities operate today under the name Ageas. The toxic structured credits were placed in an SPV (Royal Park Investments).
Barely had Fortis been saved than it became clear that Dexia too needed assistance. Besides refinancing problems caused by the market disruption in the days following the Lehman collapse, Dexia faced problems with its US subsidiary FSA, which specialised in local-government finance in the United States. As a bond-insurer, FSA had also invested heavily in structured products linked to American mortgage loans. Less than a week after they had pumped 6.4 billion euros into Dexia, the governments of Belgium, France and Luxembourg were obliged to provide the bank with a collective guarantee to the tune of 150 billion euros at the beginning of October 2008 in response to the persistent deterioration in its funding situation.
KBC was also obliged to turn to the government for support following a reduction in the credit rating of products securitised by KBC Financial Products, which obliged KBC to announce a substantial loss on its CDO portfolio. To bolster the bank’s capital buffer, the Belgian Federal government lent KBC 3.5 billion euros in hybrid capital at the end of October 2008. KBC’s capital base was further strengthened in January 2009 by a transaction with the Flemish regional government for another 3.5 billion euros. The intervention came in response to sharp falls in KBC’s share price. In May 2009, the federal government provided KBC with a 20-billion-euro guarantee on CDOs held by the bank.
In the wake of the government intervention in 2008 and 2009, Dexia and KBC were required to submit far-reaching restructuring plans to the European Commission, with the aim of reducing their risk profile and scaling back their total assets. In KBC’s case this entailed shrinking its portfolio of international loans and its market activities, as well as certain activities in Belgium and Eastern Europe. KBC’s bank-insurance model remained intact, however. For its part, Dexia agreed to reorient its activities towards traditional financial intermediation. The intensification of the euro debt crisis in 2011, which was marked by a fall in the value of sovereign paper from several countries, nevertheless weighed on Dexia’s funding conditions – all the more so as this was accompanied by lower interest rates. The rating agency Moody’s downgraded Dexia’s outlook to ‘negative’ at the beginning of October 2011, leaving the bank in a highly precarious liquidity position. Dexia had no option but to turn to the government once again for support The Dexia group was broken up entirely at the end of October 2011. The Belgian government acquired all the shares of Dexia Bank Belgium (later renamed Belfius) while the Belgian, Luxembourg and French governments drew up a guarantee scheme to fund Dexia’s residual bank activities.
The support measures taken in 2008–2009 in the shape of shareholdings and provision of loans to systemically important financial institutions (Fortis, Dexia, KBC and Ethias) came to a total of just over 20 billion euros representing around 6.3% of Belgian GDP in 2009. By way of comparison, support to financial institutions for the euro area as a whole in the period 2008–2009 amounted to 1.6% of EMU GDP. In addition to capital injections, the Belgian government provided state guarantees on various types of financial institution transactions. These outstanding guarantees peaked in 2009 at 62 billion euros or over 18% of GDP. It ought to be noted that the government ultimately made a capital gain on some of the support it had provided. By the end of 2015 (five years earlier than scheduled), for instance, KBC had repaid a total of 13.1 billion euros to the federal and Flemish governments, in return for the 7 billion in support the financial institution had received.
Economic recession and recovery plan
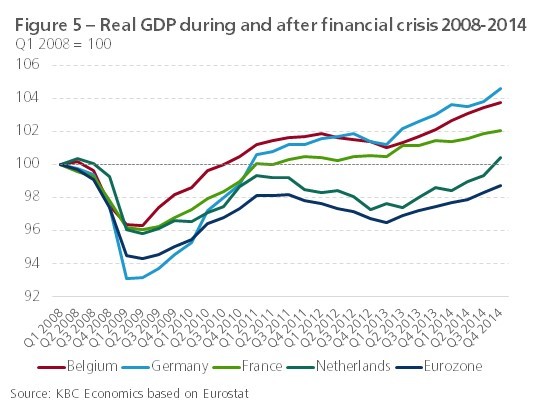
Leaving aside the banking crisis, the Belgian economy came through the first phase of the financial crisis and economic recession in 2008–2009 relatively well. Economic activity in Belgium declined by 3.8% between the middle of 2008 and mid-2009 (the Great Recession). The downturn was smaller than in most other euro countries, but was still the most severe since the Second World War, as was the case almost everywhere. During the previous recessions that began in 1974, 1980, 1992 and 2000, real Belgian GDP had fallen by 2.5%, 1.8%, 2.0% and 0.5% respectively compared to the preceding peaks. A gradual recovery began in the spring of 2009 and by the middle of 2010 Belgium was one of the first EMU member states in which real GDP once again surpassed its pre-recession peak (figure 5).
Recognition of the major risks entailed by the crisis prompted the Belgian government not only to support the financial sector but also to take economic recovery measures of its own. These were chiefly intended to provide a shot in the arm to businesses and household purchasing power. Permanent measures included a general reduction in payroll withholding taxes, specific cost reductions for night and shift work, overtime and researchers, and an increase in benefits for the temporarily unemployed. Temporary measures were also taken, such as a reduction in VAT on newbuild homes and a one-off discount on electricity bills. According to central bank calculations, interventions made in the context of the 2009–2010 recovery plans amounted to almost one percentage point of GDP – a rather limited amount compared to other euro countries. In addition to explicit intervention, however, a significant role was played by the automatic stabilisers inherent to the social security system.
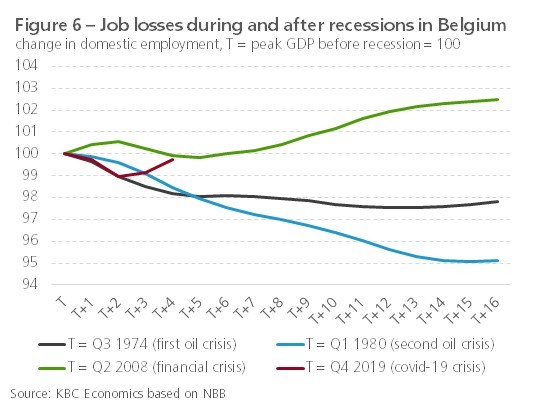
The jobs market held up well during the crisis, despite the economic slump. The employment rate fell by 0.6% between the end of 2008 in the autumn of 2009, which was significantly less than during previous recessions (figure 6). The downturn in activity had a substantial impact in Belgium on the number of hours worked per employee, but much less so on the number of unemployed people. This is because the government encouraged ‘labour hoarding’, in which companies maintain their workforce level pending an economic recovery through measures that allow hours worked to be temporarily reduced. The system of ‘temporary unemployment for economic reasons’ was applied on a large scale, affecting roughly 6% of all workers at its height. From the beginning of 2009 onwards, new systems were additionally introduced, including a ‘crisis credit’ and a new system of temporary employment for white-collar staff. Labour hoarding is also likely to have reflected rigid labour laws that make it hard and expensive to make staff redundant as well as the difficulties companies might subsequently encounter in recruiting appropriate employees after the crisis. The latter related in turn to the structural problem of ‘bottleneck jobs’, which had continued during the crisis.
In addition to resilient employment, an indexation effect likewise meant that household consumption did not suddenly collapse during the recession. The upturn in inflation in 2008 triggered an index-linked increase in pay and welfare benefits in 2009, with the result that households’ real disposable income actually rose sharply at the height of the crisis. The all-in-all limited correction in private consumption that did occur during the recession was attributable to a substantial, temporary rise in the household saving rate in response to increased uncertainty. A converse pattern was seen during the economic recovery that followed: real disposable income contracted in 2010, but the fall in the savings rate caused by the easing of uncertainty meant that consumer spending was able to grow substantially in that year. Despite the high degree of labour hoarding in the jobs market during the recession, there was no question of a jobless recovery. New jobs were, however, primarily created in the service sector and were strongly underpinned by the government via an increase in public-sector and healthcare employment as well as a subsidised system of ‘service vouchers’.
Through ‘second-round effects’, the automatic wage indexation system also resulted in positive inflation differences between Belgium and the euro area and especially between Belgium and its neighbours. This entailed a further worsening in Belgium’s already deteriorated competitiveness and was one of the reasons that the country’s export growth lagged that of most other euro member states. The fact that macroeconomic demand in Belgium generally declined to only a limited extent meant that Belgian businesses were not obliged to scale back their investment plans too severely. This, combined with the generally healthy financial state of businesses, explains why Belgian corporate investment contracted less than in other euro countries during the Great Recession.
Beginning of budget consolidation and structural reforms
The recovery that began in the spring of 2009 found itself undermined from the summer of 2011 onwards by heightened uncertainty in the EMU as the government debt crisis intensified. In addition to the countries subject to EU and IMF support programmes (Greece, Ireland, Portugal and Cyprus), more and more euro countries had to contend with a sharp widening in yield spreads with the German Bund. Belgium too found itself in the financial markets’ sights at the end of 2011. By the end of November, Belgian ten-year sovereign yields hit 5.85% – their highest level in 11 years. The rate spread with Germany increased to 366 basis points, its widest since the mid-80s. The widening of the Belgian spread was chiefly a reflection of problems in the EMU as a whole. As of October, however, the dismantling of Dexia and the failure to form a new federal government after elections in June 2010 also became factors. The latter created uncertainty in terms of much-needed budget consolidation and structural reforms to enhance the Belgian economy’s growth potential. Pressure on interest rates and spreads eased after the end of November, with the formation of Elio di Rupo’s government and the agreement of a budget for 2012.
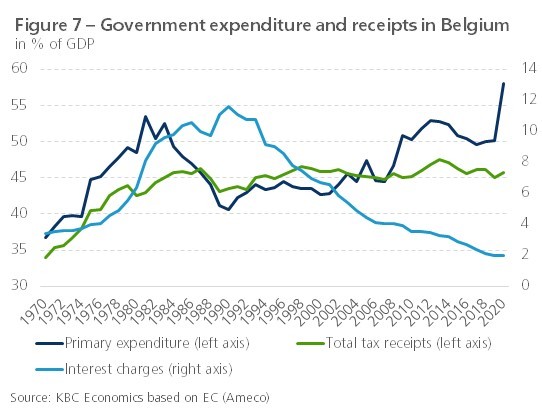
The fact that the consumer-spending trend remained favourable throughout the crisis compared to most other euro countries related not only to the aforementioned factors but also to the prolonged absence of strict measures to rebalance Belgian public finances. The Belgian government deficit peaked during the financial crisis at 5.4% of GDP in 2009, almost 6 percentage points worse than the slight surplus in 2006 (figure 4). This deterioration was chiefly attributable to the derailing of primary spending, which had already begun in the years before the financial crisis broke out (figure 7). The substantial improvement in the budget position in 2010 (a deficit of 4.0% compared with the 4.8% target set within the Stability Programme at the beginning of 2010) was chiefly attributable to the stronger-than-anticipated economic recovery in that year.
The prolonged coalition negotiations in 2010–2011 meant that work on consolidating the public finances did not begin in earnest until 2012. All the same, Belgium closed that year with a deficit of 4.2% of GDP. Both the general government budget balance and the structural balance turned out lower than the EMU average, something that had not occurred in the period 1985–2011. The main reason for this was the fresh capital injection in the residual Dexia bank (to the amount of 0.8% of GDP). Even without this operation, however, the deficit would have come to over 3% of GDP due to the renewed economic downturn. The 3% target set by Europe under the excessive deficit procedure was not met. What’s more, the average annual structural effort in 2010–2012 amounted to just 0.3% of GDP, clearly lower than the 0.75% Europe had asked for. Belgium was nevertheless able to avoid a European fine, although it was obliged to upgrade its structural efforts for 2013 and 2014. Aside from a slight breach in 2014, the 3% standard was met each year after 2013. Little further progress was made, however, in reducing the deficit. The goal of a balanced budget was, furthermore, consistently postponed: in 2012, budget equilibrium was to be achieved by 2015; in 2013 the date was put back to 2016; and in 2014 it was decided that the target would not be met until around 2018.
Where policy had initially focused on alleviating the short-term consequences of the crisis, a start was made in 2012 on structural reforms to guarantee the long-term sustainability of the public finances and to ratchet up the growth potential of the economy. The di Rupo government announced preliminary reforms to the pension system and early retirement rules, for instance, with a view to keeping older workers in the labour market. The minimum early retirement age was raised to 60.5 with a career working requirement of 38 years. In terms of the labour market, the degressivity of unemployment benefits was accelerated and employment counselling for older job seekers was expanded. Funding was also provided to reduce the tax burden on certain categories of employee by cutting social-security contributions. To help restore competitiveness, measures were introduced to rein in inflationary pressure on pay without interfering with automatic wage indexation. The index used for this purpose was adjusted, for example, to align it more closely with actual consumer behaviour. At the same time, the initiatives included a real wage freeze for the period 2013–2014.
4. Economic policy takes new turn (2015–2019)
Economic policy in Belgium in 2008–2014 continued to focus more than that in most euro countries on supporting domestic consumption. Wage moderation did not occur for a long time, due in part to automatic indexation, the prolonged character of unemployment benefits protected purchasing power, and employment was supported by job creation in the public and subsidised sectors. Because of this, economic growth remained stronger than the euro-area average in the years in question. It was accompanied, however, by a deterioration in the balance-of-payments current account (figure 2). What’s more, decent short-term growth reduced the sense of urgency for reforms to ratchet up the low workforce participation rate and the long-term sustainability of the public finances. Both primary expenditure and taxes rose close to the record levels of the early 1980s (figure 7). Insufficient measures were taken, by contrast, to safeguard the long-term ability to fund the costs associated with an ageing population and to make the functioning of the government more efficient. The increasing tax burden and the lack of wage moderation exacerbated the competitive handicap compared to neighbouring countries and impeded entrepreneurship. Only in 2013 was there a freeze on real wages and were measures taken to rein in inflationary pressure on pay.
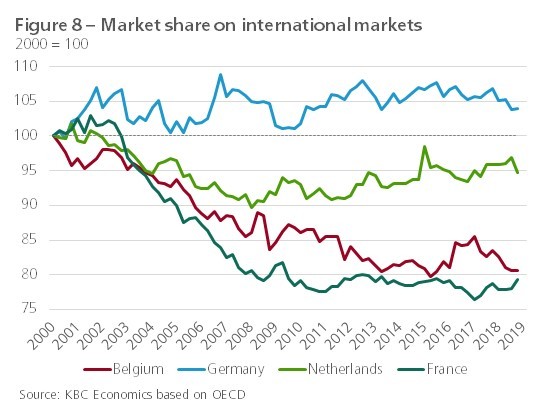
The policy shift announced by the Michel government in October 2014 changed the emphasis of economic policy from supporting consumption to bolstering the supply side of the economy. Reducing labour costs was a central plank of the new policy. In addition to a direct reduction in wage costs – a cut in employers’ contributions from 33% to 25% by 2019 – automatic wage indexation was skipped for the first time since the 1980s by means of a one-off ‘index jump’. Wage moderation ensured that the handicap relative to neighbouring countries narrowed and that the unfavourable trend in the current account and the diminished share of international markets were reversed (figure 8). Enhanced competitiveness also created a more favourable seedbed for corporate investment and growth in private-sector employment. The reforms were likewise intended to amend the 1996 wage norm act by furnishing a correction mechanism: henceforth the wage-cost handicap built up in respect of neighbouring countries had to be deducted from any negotiated pay rises.
The new policy also tackled further pension reform and the functioning of the labour market. In the case of the former, this related primarily to the further tightening of the career working requirement for early retirement that had been introduced at the time of the previous reform in 2012. What this amounted to was that the minimum retirement age for most employees rose from 62 to 63. It was also decided to raise the statutory retirement age from 65 to 66 in 2025, and to 67 in 2030. In addition, employers would be held to account more strictly for shedding staff (prematurely) via the bridging pension scheme. Those who continue to work after the end of their career, meanwhile, were now able to build up additional pension rights. With regard to the functioning of the job market, stimuli to work were strengthened by, amongst other things, changes in the unemployment benefit system. Efforts were also made to increase the flexibility of the labour market. Employers could henceforth apply a flexible working week by calculating working time on a yearly basis. An improved regime for night work was also introduced, which would particularly benefit e-commerce.
The measures further included a series of cuts in government spending and a shift within the tax mix to fund the reduction in labour costs. The tax shift did not go very far, however, and only entailed a minimal ‘greening’ of taxes via higher duties on diesel and several selective VAT increases. Changes to taxation also include an increase in withholding tax from 25% to 30%, a stock-market tax and a tax on fuel cards provided by employers to their personnel. The consolidation process sketched out here for the public finances placed a strong emphasis on savings on the spending side. This occurred in part through firm, ongoing cuts in social security and by economising on the government’s own operations. The policy goal of a balanced budget was postponed to avoid adversely affecting economic growth in the short term.
5. Economic policy during the Covid-19 crisis (2020–2021)
The Covid bill blasts a hole in the budget
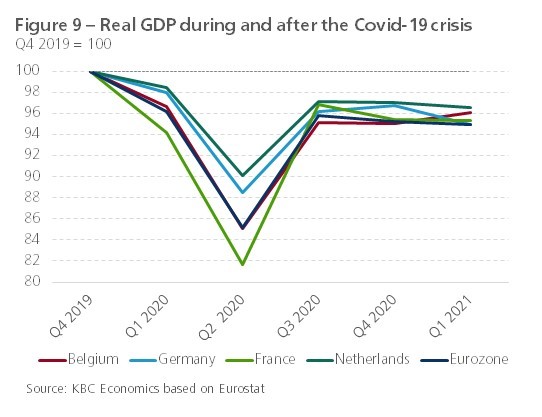
Like other countries all over the world, Belgium was confronted by the unprecedented Covid crisis in 2020–2021. Besides the grave consequences for public health, the pandemic has also had an extremely onerous impact on the socioeconomic fabric. The Belgian economy took a hit of no less than 6.3% in 2020 – something never witnessed before outside wartime (figure 1). The contraction in GDP was slightly less, however, than was suffered by the overall euro area (-6.7%). At the beginning of 2021, Belgian economic activity was still 4% below its pre-crisis level, compared to 5% for the euro area (figure 9). The Belgian government had to take drastic steps to combat the Covid pandemic. These fell into two categories: on the one hand, measures to curb the spread of the Covid-19 virus and to boost the capacity of the health-care system, and on the other to provide large-scale support to households and businesses badly hit by the crisis.
In addition to beefing up the existing automatic stabilisers, the government provided discretionary budget stimulus on an unprecedented scale. To assist households, the temporary unemployment system for workers and bridging support for self-employed people were relaxed and other welfare benefits and premiums were extended (e.g. Covid-related parental leave). Support to businesses and self-employed entrepreneurs took the form of premiums in the event of closure or sharp reductions in turnover, fiscal measures to meet the liquidity requirement and solvency risk, and aid for specific sectors. The broad package of support also took in specific Covid loans and guarantees, a moratorium on bankruptcies and deferred payments on mortgage loans and business credit for those who have been financially hard hit by the crisis. The financial sector also played a leading role in the latter regard. In the spring of 2021, when the worst of the crisis was over, the policy focus shifted towards the reopening of the most badly affected sectors (e.g. restart loans and a VAT reduction for the hospitality sector).
The total cost of the emergency measures taken by the various Belgian authorities in 2020–2021 is estimated at around 35 billion euros or 7.8% of GDP in 2020. This makes the budgetary impact of the Covid crisis somewhat larger than that of the financial crisis (the combined cost of the support measures in 2008–2010 amounted to around 7.3% of GDP). Just over a fifth of the Covid bill has gone towards tackling and managing the public health crisis. The biggest single item on the economic side was income support (over 40% of the total pandemic bill). The vast majority – almost three quarters – of the total bill has been picked up by the federal government.
The severe recession, which also triggered a collapse in tax revenues) and the direct impact of the measures drove the budget deficit up sharply from 1.9% of GDP in 2019 to 9.4% in 2020. Debt rose from 98.1% of GDP in 2019 to 114.1% in 2020 (figure 4). Because finances are expressed as a percentage of GDP, the deterioration is due not only to the direct impact of the crisis but also to the sharp fall in the denominator of the fraction. The gravity of the economic downturn triggered the escape clause in the Stability and Growth Pact, allowing EU member states to deviate temporarily from their budget targets. Compared to the euro area, the budget deficit and public debt in Belgium rose somewhat more sharply (+7.5 versus +6.6 percentage points of GDP for the deficit and +16.0 versus +14.2 percentage points of GDP for the debt). Although the recession was the most severe in the post-war decades, this was not Belgium’s worst budget result in that period: between 1980 and 1986, the deficit rose to over 10%, with a peak of 16% in 1981, while the public debt peaked in 1993 at 134% of GDP.
Limited damage to the labour market
In addition to the deterioration in the public finances, other imbalances within the Belgian economy remained within limits during the pandemic. It is striking that the harm to the labour market has been much less severe (so far) than might have been feared based on the blow that Covid dealt to activity (figure 6). The unemployment rate rose from 4.9% in the spring of 2020 to a peak of 6.5% in August, but then eased to 5.3% in April 2021. While the volume of labour did decline sharply, this was absorbed by the mass application of temporary unemployment and bridging support. When the first wave of the pandemic was at its height in April 2020, over a million workers found themselves in temporary unemployment, representing almost 40% of wage-earners in the private sector. Approximately 400 000 self-employed people – 50% of the total number – turned to bridging support. Recourse to these systems has declined sharply since, but remains high. This entails an ongoing risk that a proportion of those affected will yet end up in actual unemployment. On the other hand, the fact that the labour market is showing signs of tightness again suggests that the increase in unemployment could remain limited. This will, however, require one of the Belgian labour market’s structural problems – the mismatch between supply and demand – to be tackled (see below).
Inflation and the external position did not form a problem during the pandemic either. The virus outbreak was accompanied by a collapse in oil prices, as a result of which inflation worked out at just 0.4% in 2020. Inflation is likely to be substantially higher than this in 2021, due to the recovery in energy prices and, probably, also a certain mismatch between demand and supply as Covid restrictions are relaxed. It will remain limited, however, with an average forecast inflation figure of just below 2%. The balance-of-payments current-account surplus turned into a deficit in 2020, but this too remained on the limited side at -0.2%. The competitiveness of Belgian companies, which had sharply improved prior to the crisis, has been somewhat squeezed though. A sharp increase in wage costs was accompanied by a downturn in productivity. All this meant that unit labour costs rose fairly sharply in 2020 compared to the previous year. The increase in Belgium was 3.6%, which was lower than in the Netherlands (+5.8%), but higher than in Germany (+2.9%), France (+2.5%) and the euro-area average (+2.6%).
Recovery policy established
The Belgian authorities have set up an extensive recovery policy to address the economic and social repercussions of the Covid crisis. The majority of the measures form part of the Recovery and Resilience Facility launched by the European Commission (EC). This instrument – a cornerstone of the NextGenerationEU initiative – is intended to help member states put the pandemic behind them, while simultaneously placing the economy on the path towards a green and digital transition, thus making it more sustainable and resilient. The Belgian government submitted its National Recovery and Resilience Plan to the EC at the end of April. It comprises a total of around 80 investment and 34 reform projects, for which Belgium will receive 5.9 billion euros in EU funding in the period 2021–2026 – roughly 0.2% of estimated GDP for the six years in question. In addition to the European money, the Belgian authorities want to pump extra funding of their own into the economy. The ambition is to raise the level of government investment in Belgium to 4% of GDP by 2030.
The EC still has to evaluate, however, whether the proposed projects will indeed bolster growth potential, create employment and encourage economic and social resilience. A green light for the promised funding will likewise be conditional on a genuine contribution to the green and digital transition. According to the Federal Planning Bureau, 88% of the Belgian plan would go directly towards an increase in the capital stock of the Belgian economy, via government investment and investment support for the private sector. A substantial proportion relates to infrastructure work, including the renovation of buildings, cycle paths and public transport, but also investment in intangible fixed assets (including R&D). Some 57% of the projects can be labelled as ‘sustainable’ and 31% as ‘digital’ – more in each case than the minimum required by Europe (37% and 20% respectively).
A potential drawback of the plan is the fragmented nature of the measures, which reflects the need to satisfy the desires of the different authorities and could diminish its effectiveness. What’s more, the plan incorporates a great many catch-up investments that were needed anyway, and it lacks a route towards structurally increasing government investment. The plan’s strength lies in its linkage of investment and reform, although its specific fleshing-out remains vague (the fiscal and pension reforms will be presented later in 2021). Meanwhile, as a small, open economy, Belgium is likely to benefit from the recovery plans in other EU countries as well. In specific terms, the Federal Planning Bureau expects the impulse provided by the Belgian recovery plan to be rather limited in the short term. At the peak of the restart effect – in 2022, when 1.5 billion euros in funding will flow into the economy – this will boost economic activity by 0.2% compared to a scenario without the plan. Job creation is expected to remain limited too: at its 2022 peak, the plan will only create an additional 4 000 jobs.
6. Future challenges remain substantial
The government made a start on important reforms in the years prior to the pandemic, chiefly with a view to longer working and restoring competitiveness (see Section 4 of this report). Despite the many, often small interventions, the progress of reform is still too limited, however, in view of a number of stubborn imbalances with which Belgium continues to be confronted. What’s more, the shift in the policy focus towards reining in the pandemic has diminished reformist zeal during the Covid crisis. Without wishing to be exhaustive, we focus once more in the final section of this report on the most important challenges, which already existed prior to the crisis and which the presented recovery plan will also have to address
Ratcheting up growth potential
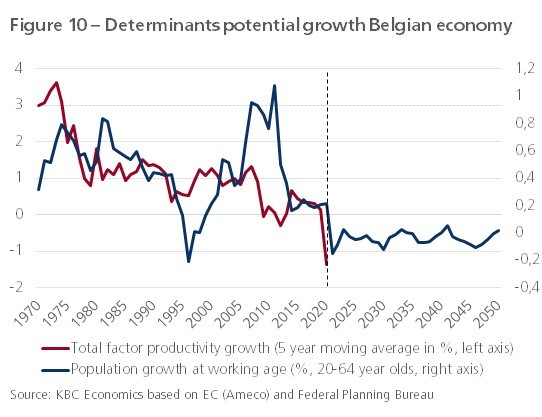
A first major challenge relates to ratcheting up long-term growth potential, which faces pressure from the imminent contraction in the working-age population. According to the Federal Planning Bureau’s demographic forecasts, the population in the age range 20–64 will begin to decline from 2021 onwards (figure 10). To ensure the availability of sufficient labour potential, the workforce participation rate will have to be raised further (see Section 6.3). Also concerning is the downward trend in total factor productivity (TFP), which measures the quality and efficient deployment of labour and capital. Slower TFP growth is partially attributable to a number of interconnected factors, for which Belgium either has a somewhat mediocre score in European teams or a relatively good but declining score. They include less-than-dynamic entrepreneurial demographics (relatively few start-ups and closures), the decline in the quality of education and the still inadequate coordination of education with the needs of business, together with innovation that remains too strongly focused on rationalising production processes and too weakly on the development of innovative products or carving out new markets.
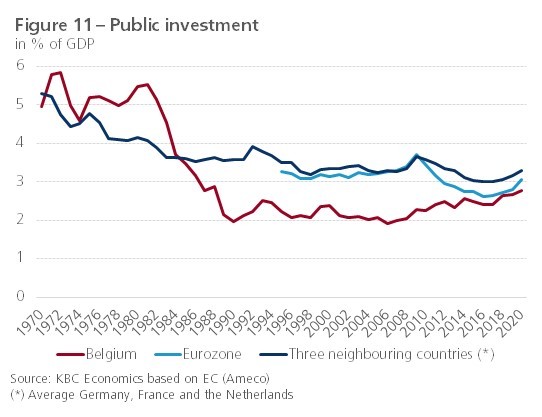
In order to boost TFP growth, it is vital to create an environment in which corporate investment and innovation are able to thrive. Policy will have to focus in this respect on stimulating the entrepreneurial culture via, amongst other things, effectively functioning labour and product markets, sufficient competition and simplification of excessive regulation and complex taxes. In practical terms, the most important levers for lifting productivity are the creation of new, high-potential businesses and the fading away of the least efficient companies. The ecological transition and digitalisation and robotisation of the economy will play a role in this. The government will have to facilitate these transitions, which also entails the ongoing correction of years of underinvestment. Despite the increase seen in recent years, gross government investment of 2.8% of GDP in 2020 is still relatively low by European standards (figure 11). The result is a relative decline in quality in public infrastructure and a lag in public R&D spending. Increasing road congestion is a related factor, which also puts a brake on potential growth. It harms Belgium’s image as an attractive country in which to invest, while businesses in urban zones are finding it increasingly hard to recruit competent personnel. Given that the room for budgetary manoeuvre will remain limited, it will be a question in the years ahead of orienting investment, some of which forms part of the post-Covid recovery policy, as efficiently as possible towards projects that ratchet up potential growth to the maximum degree.
Safeguarding competitiveness
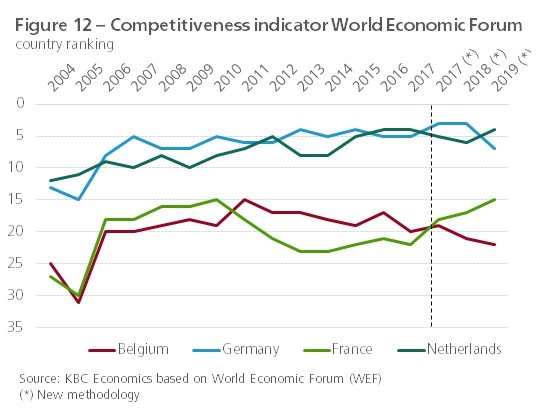
Following a short-lived improvement in 2015–2017 thanks to wage moderation, Belgium’s share of its international markets has begun to decline again in recent years (figure 8). This deterioration relates to aspects of competitiveness on which Belgium is a somewhat weak performer, besides wage costs. Figure 12 shows the pattern of Belgium’s position and that of its neighbours according to the World Economic Forum’s competitiveness yardstick, which takes such aspects into account. Belgium was able to improve its position between 2005 and 2011, but has since gone into reverse. Germany and the Netherlands have scored much better and Belgium’s performance has also deteriorated in recent years compared to its neighbour France. Like France, Belgium scores poorly on the following elements of the competitiveness benchmark: business dynamics, skills, product market and labour market. In terms of the institutions, infrastructure, ICT adoption and innovation capacity elements, Belgium’s score is actually worse than that of all three neighbouring countries. In concrete terms, it is partly a question of aspects that weigh more generally on the potential growth of the Belgian economy (e.g. government regulation, high fiscal pressure, rigid labour market functioning). With specific reference to international trade, the relatively low added value of Belgian exports is a concern. The country largely specialises in intermediate goods and to a relatively lesser extent on innovative finished products. What’s more, Belgium is managing increasingly but still insufficiently to orient its exports towards distant, emerging growth markets.
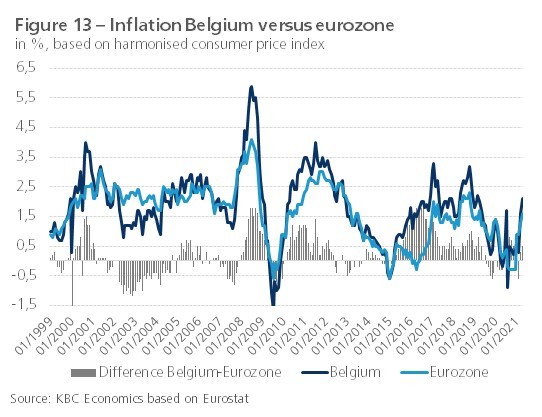
One problem calling for particular attention is the relatively high rate of inflation. Measured by the Harmonised Consumer Price Index, Belgium’s monthly inflation figures have been 0.4 percentage points higher on average than the euro area since the beginning of 2008 (figure 13). Belgian inflation has proved more sensitive than that in most euro countries to movements in the oil price, due to the relatively high energy intensity of the Belgian economy. Rising oil prices in 2007–2008 and 2010–2011, for instance, caused inflation to rise faster here than elsewhere. The difference in inflation compared to the euro area was also attributable to the relatively strong price dynamic in certain service sectors (e.g. in telecommunications due to weak competition). Combined with automatic wage indexation, higher inflation in Belgium implies a risk of a wage-price spiral. More specifically, wage indexation makes the competitiveness of the Belgian economy vulnerable to external price shocks. The European Commission, the OECD and the IMF have all been calling for some time now for a fundamental overhaul of the Belgian wage-setting mechanism. If automatic indexation is retained as the ‘sacred cow’ of wage-setting, constant vigilance will be required to ensure that consumer-price inflation does not get out of hand.
More people at work
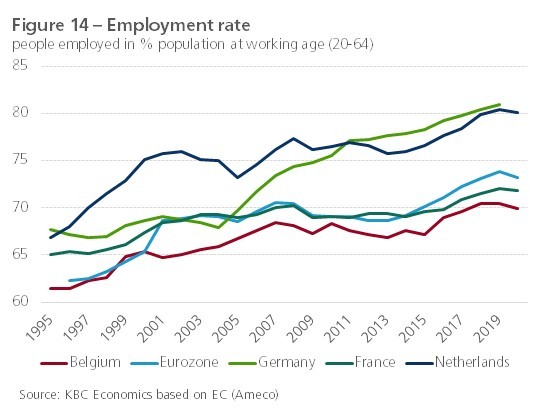
Another imbalance calling for constant attention relates to the underutilisation of the potential workforce. The labour market improved in the years prior to Covid chiefly thanks to favourable economic growth, with a great many structural problems remaining unaddressed (see below). Belgium’s employment rate in 2020 was 69.9%, due in part to the downturn during the crisis, which remains far removed from the government’s target of 80% by 2030. The country’s neighbours – the Netherlands and Germany – have already achieved that rate (figure 14). The problem is not so much a reflection of high unemployment, which despite the intense crisis remains at a relatively low level, but rather the large inactive group of people who are not, or no longer, seeking (temporary) work. It is made up in part of numerous inactive adults who, like the unemployed, qualify for welfare benefits (various exemptions due to age or professional history, company allowance, social and family reasons, time-credit, ‘themed leave’, etc.). Official inactivity figures are an underestimate, as no account is taken of outflow within the employed group due to long-term sick leave, which has risen to record heights in Belgium in recent years.
Raising the employment rate is crucial given the imminent contraction in the working-age population and signals that labour shortages will swiftly return after the crisis. The government will have to fight on several fronts at once. It is a matter of aligning the labour supply more effectively with demand, through more intensive activation and reorientation of the unemployed towards jobs the market actually needs, but even more so of getting other inactive people back on board. At the same time, a greater effort is needed to steer people who have suffered a long-term illness back into employment. Special attention is required for several structural bottlenecks in the Belgian labour market. The first of these relates to the still high number of people who exit the labour market early. While the workforce participation rate among the over-55s has risen in recent years, the level of 53.6% in 2020 was still 7.5 percentage points below the euro-area figure. A second is the difficulty in integrating Belgians with a migrant background. Nowhere in Europe does the employment rate for indigenous people differ so much from that of ethnic minorities. In 2020, just 52.3% of all 20–64 year-olds of non-EU nationality were in work, compared to 61.7% for the euro area. Changing this will require measures that offer citizens with a migrant background structurally better educational and employment opportunities and encouragement to take those opportunities when available. A third point of concern is the high degree of regional divergence. With the exception of Italy, regional differences in employment rates are not as high anywhere else in the euro area as they are in Belgium. The regionalisation of labour market policy enshrined in the Sixth Constitutional Reform in 2014 made it possible to pursue a target-group policy tailored to each Federal Region. So far, however, this has not significantly alleviated regional discrepancies.
Stabilising the public finances
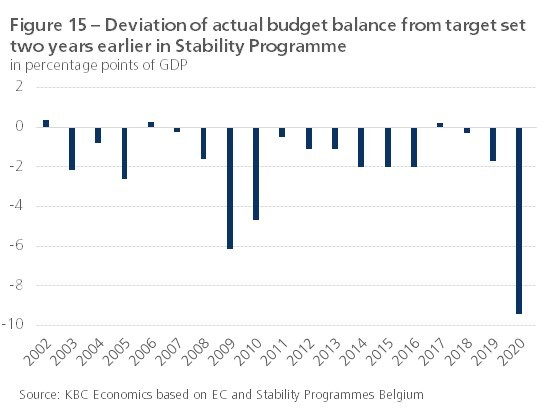
The Covid crisis dealt a severe blow to Belgium’s public finances. It is not surprising that the deficit should have risen sharply in 2020, given the government measures needed to shore up the economy in exceptional circumstances. What is problematic is the fact that insufficient use was made of the favourable economic situation prior to the crisis to stabilise the public finances. In more general terms, the government has almost never succeeded in the past two decades – even in non-crisis years – in actually meeting its own targets set out in the annual Stability Programmes (figure 15). Because of this, the public finances have remained far removed from the intended structural balance. Combined with the high level of debt, this has undermined the capacity to absorb economic shocks. The unfavourable starting position at the outbreak of the pandemic is yet another illustration that Belgium’s budget policy has too often been pro-cyclical: budget surpluses have not been built up in periods of clear economic growth, while restrictive action has had to be taken in periods of low economic growth. This entails the risk of the economy falling into a vicious circle.
Efforts will be needed after the crisis to guarantee the sustainability of the public finances in the longer term. Account will also have to be taken in this regard of the rising costs associated with demographic ageing. It is important that consolidation does not become counter-productive. Over-hasty and intense consolidation could stifle the economic recovery, potentially wiping out the intended deficit and debt reduction. This ought not to be taken as carte blanche, however, for doing little or nothing. By addressing consolidation in as growth-friendly a way as possible (e.g. raising government efficiency, a focus on cost-savings rather than new taxes, greening the tax-base, not trimming investment) and backing this with growth-supporting structural reforms (e.g. further dismantling administrative costs, simplifying taxes, making labour and product markets more flexible) could alleviate the deterioration in the public finances while also boosting potential growth. After all, ratcheting up economic growth and the employment rate will provide an important basis for safeguarding the sustainability of the public finances in the long term.
Bibliography
Baugnet, V. and Dresse, L. (2011), ‘Verloop van de particuliere consumptie tijdens de afgelopen drie jaar’, Economisch Tijdschrift NBB.
De Grauwe, P. (2007), ‘Beloften en realisaties van de paarse coalitiepartners’, Leuvense Economische Standpunten 2007/114.
European Commission, ‘Stability and Convergence Programmes’, various years.
IMF, ‘Article IV Consultation – Staff Report’, various years.
Vandeputte, R. (1987), ‘Sociale geschiedenis van België 1944-1985’, Lannoo.
Van Gompel, J. and De Boeck, E. (2014), ‘Belgische economische politiek neemt nieuwe wending’, KBC Economische Berichten, no. 22.
Van Poeck, A. (1994), ‘Economische politiek: principes en ervaringen’, Garant.
Van Poeck, A. and Van Gompel, J. (2013), ‘Economische politiek: principes en ervaringen’, Garant.