
Construction costs push up prices of new and existing dwellings


Prices of existing and new dwellings in Belgium have followed a fairly similar upward trend in recent decades. However, over shorter periods, they were sometimes temporarily out of sync. Within the past two decades, this was especially the case in the years after 2004. Existing dwellings became relatively more expensive than new ones, which, only after some time, also pushed up the new-build market. Since 2016, the prices of existing and new dwellings have again been running in parallel. It seems that this time, conversely, the sharp rise in new-build prices, via the upward pressure of rising construction costs, is a driving force behind the equally sharp rise in prices of existing dwellings.
Households looking for their own home have to make the trade-off between buying an existing dwelling on the secondary market or building a new one. In a sense, the two are substitutes. This implies that, although a new-build house will often be more expensive than an existing one, the prices of both housing categories move fairly parallel to one another. After all, if the price of one category were to rise faster (without there being a commensurate improvement in quality), the other category would become relatively more attractive. Due to the increasing demand for it, the price of the other housing category will then also rise. This demand-side arbitrage largely eliminates differences in price dynamics between existing and new dwellings in the longer term.
In practice, however, existing and new dwellings are not perfect substitutes, so prices in the secondary and primary market may be somewhat out of sync, especially in the shorter term. Differences in price developments can occur due to composition effects, i.e. differences that arise in the characteristics of the two housing categories (type, size, energy performance, location, etc.). Changing household preferences or a lack of transparency on both housing markets can also cause the prices of existing and new dwellings to (temporarily) diverge.
Figure 1 shows that, viewed over a longer period, the price trend of existing and new dwellings in Belgium was actually quite similar. STATBEL, the statistical office of the Belgian government, publishes a breakdown of the price data for both housing categories since 2005. For existing dwellings, there are also data for earlier years, but for new dwellings, we constructed an approximate index ourselves for the years before 2005 by taking the average of the ABEX building cost index and the building plot price.
Tobin's Q of the housing market
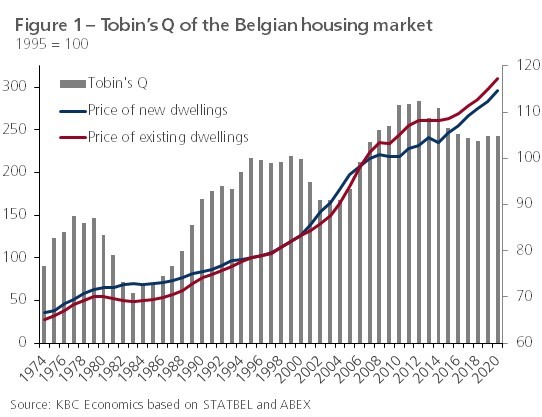
In the literature, the relationship between the price of existing and new dwellings is known as the Tobin's Q of the housing market. It indicates the extent to which the prices of one dwelling category increase more than the prices of the other in the rather short term. An increase in Tobin's Q means that it becomes relatively more attractive for households to build rather than buy, and vice versa. Often, analyses of Tobin's Q focus on the impact that the price of existing dwellings can have on the market for new housing. In empirical studies, significant correlations are found for many countries between Tobin's Q and the volume of investment in new residential buildings. But also vice versa, it is sometimes found that new construction can 'contaminate' the prices of existing dwellings. This is possible, for example, when it is accompanied by a modernisation and increasing attractiveness of the neighbourhood in which the new homes are built.
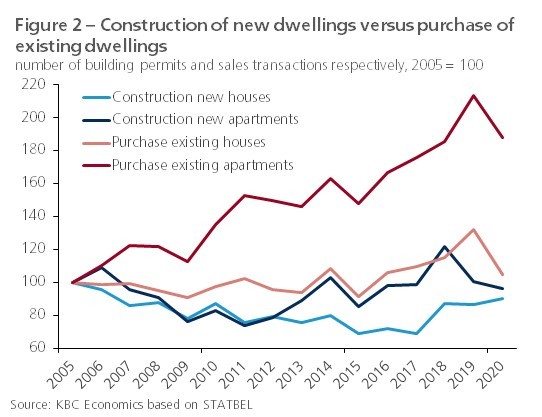
Figure 1 shows that, over the past few decades, the Tobin's Q of the Belgian housing market has fluctuated somewhat over short time horizons. Within the past two decades, the years after 2004 are particularly noteworthy: existing housing became relatively more expensive than new housing, which, only after some time, resulted in additional investments in new housing units and in prices for both categories of housing coming back into sync. Initially, from 2013 onwards, these residential investments mainly involved apartments and only later, from 2018 onwards, slightly more houses (figure 2). Compared to many other European countries, the adjustment process of the new housing market in Belgium is rather slow, which is due to the high population density, leading to land scarcity, and to the relatively heavy regulations on land use planning and procedures for obtaining a building permit.
Impact of rising construction costs
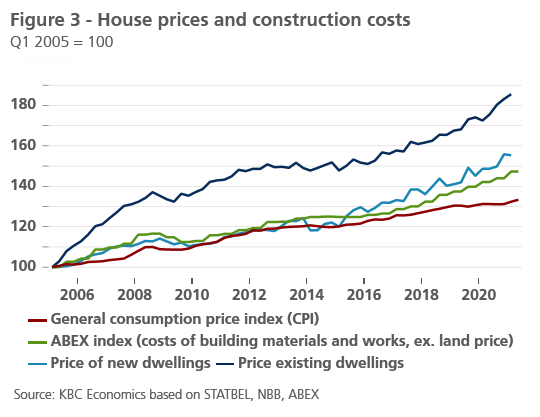
Since 2016, the prices of existing and new dwellings in Belgium have again followed a parallel course. For both housing categories, price dynamics have picked up sharply since then. Between the beginning of 2016 and the beginning of 2021, the prices of existing and new dwellings rose by no less than 22.8% and 21.9% respectively. It is noteworthy that this price boom was accompanied by a sharp increase in the cost of new construction (figure 3). The ABEX index, which reflects the cost of building materials and works, rose twice as much (+17.1%) as the general consumer price index (+8.5%) since the beginning of 2016. The development is linked to new requirements for new buildings (in terms of energy performance and safety) and, more recently, significantly more expensive building materials.
It seems that this time, conversely, the strong price increase of new construction, through the upward pressure of construction costs, is a driving force behind the equally strong price increase of existing housing (alongside other common determinants, including the low interest rate environment). The sharp rise in construction costs makes new-builds no longer feasible for many households, which makes existing dwellings again relatively more attractive. Figure 2 shows that the stronger demand for housing from households in recent years has also, relatively speaking, involved more existing dwellings. To keep the Belgian housing market 'healthy' (i.e. affordable), it will be necessary to ensure that building costs remain under control.