

Brussels is middle of the pack in comparison to European cities


- 1. Introduction
- 2. Methodological approach
- 3. Performance of European cities
- 4. Performance of Brussels
- 5. Concluding considerations
- Read the publication below or click here to open PDF

Abstract
Cities often play an important role in economic, social and sustainability outcomes. It is therefore useful to map their performance in this respect. In this research report, we do so by juxtaposing and aggregating a large number of existing city indices around various themes into a new composite city index. The exercise, limited to 19 major European cities (mostly capitals), shows that London, Paris and Stockholm generally excel, while Warsaw and Budapest dangle by the tail. Brussels is characterised by mediocrity.
Research on socioeconomic performances within Europe usually focuses on cross-country differences. This has to do with the fact that the European Union is first and foremost a federation of states and therefore has a relatively wide availability of all kinds of (reliable and comparable) data at the country level, most of them provided by Eurostat. This good data availability also still exists, albeit to a lesser extent, for the European regions (according to the NUTS nomenclature), but much less so at the urban level. Nevertheless, it is important to map the differences in social and economic developments and other areas also at this lower level of (large) cities. There are several reasons for this.
First, about three-quarters of the total European population currently lives in cities and suburbs, and the percentage of the urban population continues to increase. The concentration of consumers, workers, companies, (in)formal institutions etc. in one place makes urban areas poles of attraction in various fields (economic activity, knowledge and innovation, tourism and culture, politics, etc.). In addition, many problems or challenges we face as a society have a strong urban dimension. They occur strongly in and around cities (e.g., poverty, social segregation, inadequate housing, traffic congestion, air pollution, etc.) or cities are relatively vulnerable to them (e.g., flooding, heat, illegal migration, crime, etc.). Not infrequently, they can also be solved relatively more easily in and through cities (e.g., resource efficiency, sustainable mobility, etc.).
A number of agencies, including Eurostat, publish all kinds of data on capital cities and other major cities in Europe. While useful, these figures tend to cover only specific aspects of detail on demographic, social, economic or other developments in cities (e.g., population composition, GDP per capita, employment rate, unemployment rate, etc.). In this research report, we adopt a different approach to map the performance and challenges of European (capital) cities. We do so using a set of existing composite city indices, published by various agencies, that score or rank cities according to a variety of themes, such as their economic potential, longevity and quality, cultural dynamism, environmental impact, mobility and infrastructure, among others.
In section 2 of this report, we first explain our methodological approach, being the city indices taken into account as well as their aggregation into a new composite indicator. Then, in section 3, we discuss the performance of European cities. In section 4, we focus in more detail on Brussels, the Belgian capital. In section 5, we make some concluding considerations.
An Internet search led us to a total of 19 city indices, each focusing on a particular theme. Most indices include not only EU capitals but also other major European cities, often outside the European Union (especially Frankfurt, Munich, Barcelona, Milan, Geneva, Zurich, Bern, Oslo). Unfortunately, not enough data are available for all indices and cities to meaningfully include them in our exercise. Therefore, we limit our analysis to a group of 19 cities and 18 indexes.1 The cities taken into account include 14 capitals of EU countries (Paris, Berlin, Brussels, Amsterdam, Madrid, Rome, Vienna, Dublin, Copenhagen, Stockholm, Helsinki, Prague, Warsaw and Budapest), augmented by three other major EU cities (Munich, Barcelona and Milan) and two major non-EU cities (Zurich and London).
Table 1 provides a brief description as well as the main themes and source of the 18 city indices included in the exercise. Each of these are composite indices, taking into account a multitude of information around certain themes.2 Although we speak here of “indices," some involve a simple ranking of cities. The themes taken into account by the city indices are very diverse, with some having a rather economic interpretation (e.g., City Economic Competitiveness), others a more social interpretation (e.g., Quality of Living City Ranking). Many of the indexes also include sustainability issues in one way or another. Some indexes (e.g., Sustainable Cities Index) take the sustainability theme explicitly as a starting point. Taken together, the 18 indexes provide valuable insights into the overall attractiveness and sustainability of cities as places to live, visit, and do business.
In Section 3 of this report, we discuss the cities' performances within the city indices as a whole. For each of the 18 indices retained, we use the latest available data: for most, these relate to 2021, 2022 or 2023, but for a few indices, the data are slightly older. We additionally consider a new composite indicator, where we ourselves aggregate all the individual city indices into a single whole. The aggregation is done in two ways, each consisting of several steps.
In the first aggregation, the original values of the various city indices are normalized in a first step, making it possible to compare the scores of the cities on the different indices. Specifically, for each index, the raw values of the cities are converted into a score between 0 and 100, with the worst-performing city always receiving the score 0 and the best-performing the score 100. If a city has no value for an index (which doesn’t happen often because we do not include cities with very little data across indexes), it is excluded from the normalization.
Thus, the rescaling is based on one of the following formulas, according to whether a higher index value indicates better or worse performance:
where Ni: the rescaled index value of city i; Xi: the original index value of city i; Xmin: the original index value of the city with the lowest index value; and Xmax: the original index value of the city with the highest index value.
In a second step, we calculate for each city the average of the different rescaled index values. This is an unweighted average, meaning that the 18 city indices are given equal importance in the calculation. The new indicator is then finally obtained by re-normalizing the values of the unweighted averages between 0 and 100. The city with a score of 100 then performs best among all the city indices considered, the one with a score of 0 the worst.
A major disadvantage of this first method of aggregation is that any extreme values (outliers) of a city in one or more city indices can have major consequences for the newly constructed indicator. Therefore, we also quantify a second composite indicator that does not have this problem. In this second aggregation, we first convert the original values of each city index into a ranking number, ranking the 19 cities from 1 (best performing) to 19 (worst performing). Then, in a second step, we average the (unweighted) ranking numbers of each city across the 18 city indexes. In a final step, where we obtain the newly constructed indicator, we again rank the cities from 1 to 19 from that average.
Table 1 - Overview 18 city indices
'(ctrl + click on the name of the index will take you to the website of the city index in question)
| City index | Korte omschrijving | Thema's | Bron |
| Global Power City Index | Evaluates cities according to their magnetism or their comprehensive power to attract people, capital and enterprises from around the world | Economy, research and development, cultural interaction, livability, environment and accessibility | Institute for Urban Strategies |
| Sustainable Cities Index | Ranks cities based on 51 metrics, across 26 indicator themes, arrayed under the three pillars of sustainability: planet, people, and profit | Planet, people and profit | Arcadis |
| Global Cities Index | A metric that seeks to quantify the extent to which a city can attract, retain, and generate global flows of capital, people, and ideas | Business activity, human capital, information exchange, cultural experience, and political engagement | Kearney |
| Global Cities Outlook | Forward-looking evaluation of how cities are creating conditions for their future status as global hubs | Personal well-being, economics, innovation, and governance | Kearney |
| Top 100 City Destinations Index | Evaluates cities' performance on economic activity, with thriving tourism infrastructure that show great potential for investment and operation amid increased digitalisation, technological advancement and sustainability developments | Economy and business, tourism performance/ infrastructure/policy, health, safety and sustainability | Euromonitor International |
| Innovation Cities Index | Measures cities' potential as an innovation economy based on a wide set of 162 indicators | Innovation in cultural assets (e.g. museums), human infrastructure (e.g. transport) and networked markets | 2thinknow |
| City Attractiveness Index | How to create the most attractive city possible in order to retain and attract talented citizens, and furthermore build a more prosperous, innovative, fair and human city | City magnetism (it inspires me) and city profitability (moving there is a good deal) | WorldWide Observatory for Attractive Cities |
| European Digital Social Innovation Index | Ranking how different European cities support digital social innovation (DSI) and tech for good to grow and thrive | Funding, skill, civil society, collaboration, infrastructure, diversity and inclusion w.r.t. DSI | Nesta |
| Cost of Living City Ranking | Compares the cost of living for expatriates in cities to help multinational companies and governments determine compensation strategies | Evaluation of more than 200 goods and services, currency fluctuations and accommodation price instability | Mercer |
| Quality of Living City Ranking | Measures conditions according to political/economic environment, medical considerations, schools, publilc services and transportation, recreation, consumer goods availability, housing, natural environment | Health standards, political stability, economic situation, education system, housing market, environmental quality | Mercer |
| Top Cities Index | Based on a survey questioning what is the best city to live in, to visit and to do business in | Livability, toerism, economy | IPSOS |
| Global 150 Cities Index | Ranking of cities according to the financial and lifestyle benefits they offer. It combines local salary levels, tax rates, living costs, and living conditions to assess how appealing each location is to live in | Financial attractiveness, living conditions | AIRINC |
| European Cities SDG Index | Scores European cities on 16 UN Sustainable Development Goals (SDGs) | Sustainable Development Goals (SDGs) | Sustainable Development Solutions Network |
| City Economic Competitiveness | Seeks to quantify the global connectedness of cities and assess their economic competitiveness | Local elements (e.g. working population), living environment, soft and hard business environment, global connectivity | UN-Habitat |
| City Sustainable Competitiveness | Cities' ability to enhance advantages in economy, society, ecology, innovation and global connection, and to seek systematic optimization to continuously meet the complex and advanced welfare utility of citizens | Economic vitality, environmental resilience, social inclusivity, technological innovation, global connectivity | UN-Habitat |
| European Thematic Cities Index | Compares European cities across the 5 C’s and identifies those most likely to be resilient in the face of unrelenting structural change as well as their individual strengths and weaknesses | Change & disruption, Climate & environment, Communities & clustering, Consumers & lifestyle, and Connectivity | Swiss Life Asset Managers |
| Smart Cities Index | Assesses the perceptions of residents on issues related to structures and technology applications available to them in their city | Infrastructure, technology | IMD |
| The Cities of the Future Index | Uses data to reveal the smartest cities in the world, with a focus on how they are adopting new technologies to create a more sustainable and liveable present and future for their citizens | Digital life, mobility innovation, business tech infrastructure, environmental sustainability | Easypark Group |
3. Performance of European cities
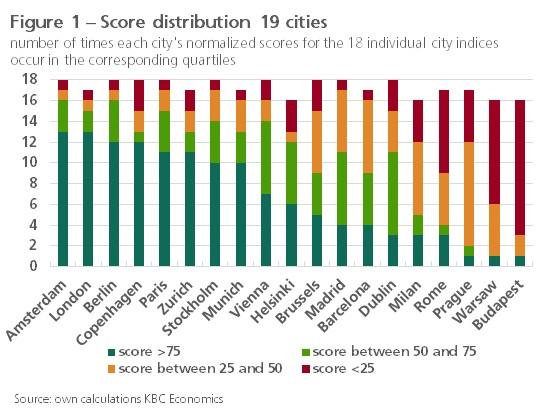
Apart from the possibility of aggregating the individual city indices into one new indicator, rescaling the values of each of the 18 indices between 0 and 100 also has the advantage of allowing us to compare the scores of the cities across indices. Figure 1 shows for each city how often the normalized score is in the four quartiles (i.e., having a score of >75, between 50 and 75, between 25 and 50, <25, respectively). Eight cities (Amsterdam, London, Berlin, Copenhagen, Paris, Zurich, Stockholm, and Munich) have scores above 75 for ten or more of the city indices considered and thus are doing very well. At the lower end, there are two cities (Warsaw and Budapest) that score below 25 for ten or more of the city indices. Both score above 75 for only one index, while Rome also scores less than 25 for eight of the indices and thus does not perform very well.
As stated earlier, because of outliers, care must be taken when considering rescaled values of the various city indices. If only one (or a few) city (cities) scores very poorly for an index relative to all other cities, then rescaling between 0 and 100 will result in those other cities quickly scoring >75 (the reverse is also true). Therefore, in figure 2, we show the distribution of the rankings of the cities instead of those of the normalized scores. In other words, the figure shows the number of times each city ranks among the first four (1-4), between 5 and 9, between 10 and 14, and among the last four (15-18) for the 18 individual city indices in the ranking. Although this way of looking over the city indices is technically better, Figure 2 presents a roughly similar picture to Figure 1. London and Stockholm manage to rank among the first four for half or more of the city indexes. The other cities that scored well in Figure 1 (Amsterdam, Berlin, Copenhagen, Paris, Zurich and Munich) also do well again in Figure 2. At the other extreme, four cities (Warsaw, Budapest, Prague and Milan) often rank very poorly and rarely well in the rankings.
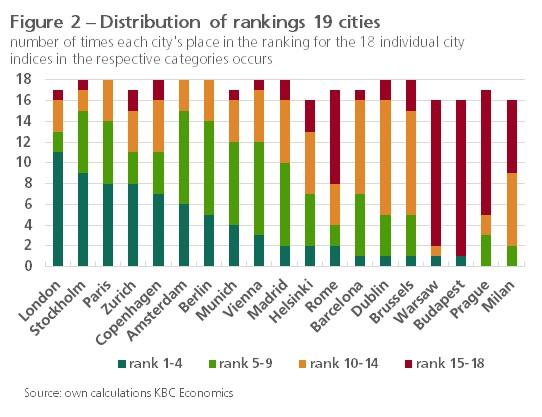
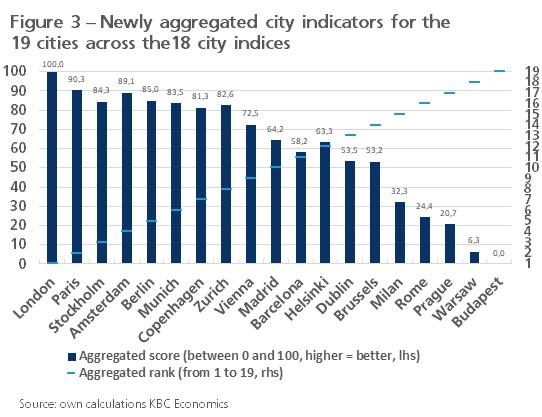
Figure 3 shows the ranking of the 19 European cities considered according to the average of each city's ranking across the 18 city indices. This newly compiled indicator conveniently combines all the places occupied by the cities for the individual city indices into one new whole. The other newly constructed indicator based on the raw scores is also shown (specifically, the averages scaled between 0 and 100 of the individual scores of the cities for the various city indices, which are also scaled between 0 and 100). Although the latter should be interpreted with caution due to possible outlier problems, it does appear to be closely correlated with the other newly constructed indicator based on the rankings.
London has the highest score by a wide margin (100), followed by Paris and Amsterdam (both around 90) and Berlin, Stockholm, Munich, Zurich and Copenhagen (between 80 and 85). These cities occupy the first eight places in the ultimate rankings, according to the newly constructed indicator based on rankings. They are followed by Vienna, which also scores relatively well. Then there is a middle group of cities (Madrid, Barcelona, Helsinki, Dublin and also Brussels), which score between 50 and 65. Milan, Rome and Prague score relatively poorly (between 20-35) and last in line are Warsaw and Budapest (0-10).
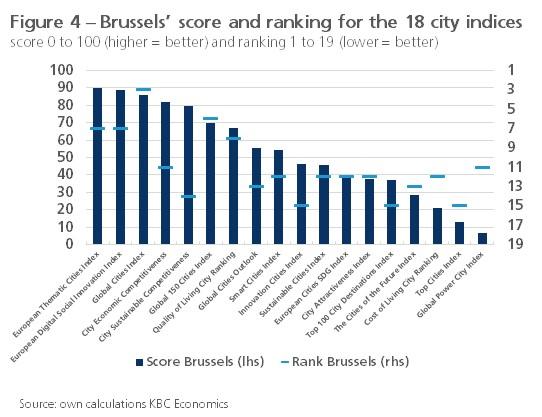
Brussels performs rather average with a score of 53 for the composite indicator. With a 14th place in the aggregated ranking of the 19 cities, Brussels' performance is even rather weak (see Figure 3). For 5 of the 18 city indices considered, Brussels scores above 75, for 3 indices, it scores below 25. For 1 index (Global Cities Index), Brussels ranks among the five best performing cities, and for 3 indices (Top 100 City Destination Index, Innovation Cities Index, Top Cities Index) it is among the four worst performing cities (see Figures 1 and 2). For some indices (City Economic Competitiveness, City Sustainable Competitiveness), Brussels has a good score (above 75) and yet a rather low ranking. This is because in these cases, most cities, including Brussels, score well on the index, and only a few other cities follow with a large gap (the outlier problem mentioned earlier). Brussels' ranking is also poor for the Innovation Cities Index (15th place), while its score is rather average (slightly below 50). For the Global Power City Index, the opposite occurs: the score of Brussels is bad (6 which is close to 0, the score of the worst performing city) but its place in the ranking (11) is still quite acceptable (see Figure 4).
Overall, the mediocrity of Brussels is striking. Due to the fact that the city indices are composite indices that have a broad scope and sometimes overlap in terms of the themes considered, it is difficult to deduce from the whole on which specific detailed aspects Brussels scores very well or badly. The performance of Brussels sometimes contradicts each other for comparable indices, which also raises questions about the quality of (some of) the indices (see also section 5). If we dig deeper into the subscores of the city indices considered in this report, we can nevertheless make some observations. Within the group of 19 cities, Brussels scores relatively well on the following detailed aspects: (1) ease of doing business and networking; (2) highly-skilled employees and flexible working; (3) relatively low cost of living and public transport; (4) cultural richness; (5) wastewater treatment. A relatively poor score is obtained on the following detailed aspects: (1) quality of institutions and local government; (2) security; (3) climate action and CO2 emissions; (4) tourist attraction; (5) greenery in the city.
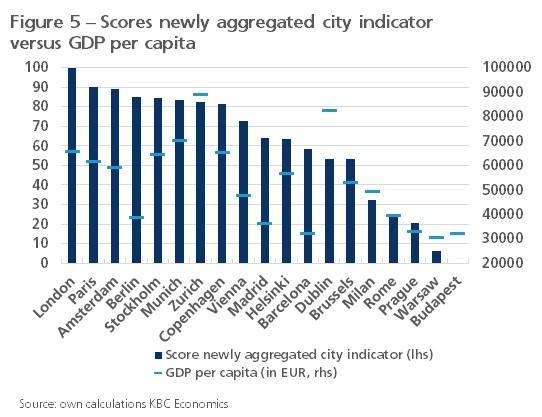
The city indices considered here each represent an attempt to measure the ups and downs of cities, each from a particular angle. It is interesting to examine the extent to which our newly aggregated index, as well as each of the 19 individual ones, is closely related to classical GDP per capita. The latter is still seen as a distinguished measure of prosperity and is also available at the level of European cities (source is Eurostat). The assumption is that cities that are doing well from an economic point of view, i.e. have a high GDP per capita, also have more resources to invest in the various topics covered by the city indices. In part, economic aspects are already included in many indices, which can also provide a positive relationship with GDP per capita. Moreover, the causal relationship can run in reverse: for example, a lot of aspects of attractiveness and sustainability of cities will promote their economic performance and prosperity.
Figure 5 relates our aggregated city index to urban GDP per capita. The relationship between the two is far from strongly positive but is significant (the correlation coefficient is 0.62).3 Berlin, for example, scores very well for our indicator yet has a rather low GDP per capita. For Dublin, the opposite is true. A possible explanation for the rather poor correlation is that a high level of economic prosperity may be associated with a poorer performance in terms of, for example, urban traffic congestion or pollution, which are aspects included in different city indices. However, for the various individual indices, the correlation with GDP per capita turns out to be negative only for the Cost of Living City Ranking (-0.64). The logic behind this is that economically strong cities tend also to be expensive cities in which to live or stay. The highest positive correlation with GDP per capita is for the European Thematic Cities Index (0.73), the lowest for the Global Power City Index (0.07).
Although our aggregation exercise of the city indices provides a new and original interpretation of the comparison between European cities, it is only a simple and quick back-of-the-envelope exercise that obviously has its limitations. No attention is paid to the extent to which different themes appear and there is also a great deal of overlap between the 18 individual city indices. Moreover, there is insufficient insight into the (relative) data quality of the various indices. The absence of some data points for a number of cities may also distort the aggregate scores. Furthermore, for the various city indices, it is by no means always clear exactly how the cities are delineated. It is likely that in most cases, not only the narrow city centre, but the broader urban agglomeration is meant. For Brussels, this is then the Brussels Capital Region. Finally, it remains regrettable that, for lack of sufficient data points, many European cities, including capitals (e.g., Luxembourg, Athens and Lisbon), could not be included in our exercise.
1 The city index not included, due to a lack of data for a sufficient number of cities, concerns the Safe Cities Index from the Economist Intelligence Unit.
Some data are also missing for the Global Power City Index (Institute for Urban Strategies) and the Cities of the Future
2 A number of indices were obtained from the same source, but clearly have a
different focus.
3 The p-value for the correlation coefficient is 0.00474, smaller than the significance level 0.05, so the coefficient is significantly different from zero.