

Advanced and emerging market sustainability
KBC Country Sustainability Barometer: update 2023


For the pdf-version of the publication click here
Abstract
Every year, KBC Economics updates its Sustainability Barometer for advanced and emerging markets. This Sustainability Barometer is used as an important input in the screening of countries for KBC Asset Management’s Responsible Investing funds. The tool takes a wide range of sustainability indicators into account and allows us to rank country performances according to their overall score. In this research report we give an overview of the methodology, minor changes to that methodology compared to previous years, and the results of the latest update (made end-2022). The most important update to the methodology this year is that while in past years we measured the performance of advanced and emerging economies separately (using nearly identical models), we now consider both groups of economies together in the same model. Unsurprisingly, advanced economies tend to outperform. While this modification makes comparing changes in the ranking from last year complicated, we still see that the Scandinavian countries and Switzerland continue to occupy the first five places in the country ranking. Among emerging markets in the ranking, the Central and Eastern European countries also continue to perform well. Belgium ranks 16th out of 110 countries considered.
Introduction
Sustainability forms an integral part of KBC Group’s general business strategy. The KBC Country Sustainability Barometer supports this strategy by providing a key input for the Responsible Investing funds (RI funds) offered by KBC Asset Management.Responsible investing in government bonds requires additional analysis, just as it does with equities and corporate bonds. This amounts to ‘country screening’ or, more specifically, analysis of the importance that national governments attach to sustainability and social responsibility in their policies. We begin this research report by sketching out what ‘sustainability of countries’ entails. We then look at the way in which countries can be analysed for sustainability. In doing so, we examine in detail the yardstick that KBC Economics has developed for its Sustainability Barometer. We also focus specifically on the adjustments we made to the screening methodology in the most recent update. Finally, we discuss the results of our most recent calculations (the 2023 update of the KBC Sustainability Barometer). 1
Sustainability of countries
Definition
There is no universal description of what the ‘sustainability of countries’ precisely encompasses, which in turn reflects the fact that the objectives and tasks of governments are more multifaceted than those of businesses. Government policy is focused overall on the sustainable promotion of general well-being – the well-being of as many citizens as possible. This is determined by a whole range of factors: material prosperity, health, personal development, justice, equal opportunities, liberties, absence of social and political tensions, security and so on. It is equally important that this well-being is not achieved at the expense of future generations, citizens of other countries, animal welfare or the environment. Consequently, aspects such as environmental sustainability and international peace have to be taken into account explicitly.
Viewed in these terms, the sustainability of countries may be defined as ‘the totality of actions, institutions and policy interventions in a country that promote the well-being of its current and future population in a sustainable manner, without jeopardising the environment or the well-being of the population of other countries’.2 However, fleshing out this definition in practice is subjective and not straightforward. In addition to the many relevant factors, subjectivity arises from conflicting views on the extent to which the government should intervene to achieve this sustainability. Opinions can range from a strong preference for far-reaching governmental correction of the potential excesses of profit maximisation by corporations (social exploitation, environmental neglect, etc.) to the opinion that, at the end of the day, free-market principles continue to offer the best guarantee of sustainable prosperity and progress (greater likelihood of personal initiative, full employment, etc.).
Methodology
Numerous yardsticks have been developed in recent decades to combine various sustainability factors into a single index. Some of these focus on just one aspect, such as Yale University’s Environmental Performance Index or Transparency International’s Corruption Perceptions Index. Broader measures primarily attempt to achieve a better indication of social well-being than traditional per capita GDP. Some of these, such as the United Nations’ Human Development Index, have become well known. Most alternative measures of well-being continue to correlate closely with per capita GDP. This is not the case with benchmarks that take substantial account of ecological aspects, like the Sustainable Society Foundation’s Sustainable Society Index or the New Economics Foundation’s Happy Planet Index, in which case the correlation is more likely to be negative.3 This is because countries with a high level of material prosperity pay a price for it in terms of environmental pollution or depletion of natural resources.
The above-mentioned indices provide an incomplete picture of what is meant by the sustainability of countries. It was for this reason that KBC decided to develop its own benchmark, which would approach the matter from as broad an angle as possible. KBC Asset Management (KBC Group’s fund manager) first calculated its ‘Sustainability Barometer’ for countries back in 2002, to serve as the basis for investment choices in its RI funds. The Sustainability Barometer, which was developed in consultation with the macroeconomists in KBC’s research department and is now updated yearly by KBC Economics, continues to serve as an important input for those funds.
The scoring model generates a country ranking using a database that is updated annually with newly available information for the different indicators. It is a dynamic model that can be adjusted when necessary to take account of new sustainability trends. KBC is advised on the various sustainability aspects by a panel of independent experts (the RI Advisory Board).
While it remains true that there is no universal definition of country sustainability, the seventeen UN Sustainable Development Goals (SDGs) provide a useful international benchmark. For this reason, we carried out an analysis this year to determine to what extent the KBC Sustainability Barometer accounts for progress on these SDGs. While most SDGs were already covered in our model, we decided to include six additional data points to fully encapsulate all aspects of the SDGs. Those additional data points are discussed below.
The KBC approach
The countries screened
The KBC Sustainability Barometer now examines both advanced and emerging market economies together. For the purposes of this screening, advanced economies are defined as the OECD countries plus member and candidate member states of the European Union (EU), which do not belong to the OECD, and Singapore. To determine which emerging markets to include in the screening, we opt for a very broad definition. Namely, we combine the differing criteria from two reputable international institutions as well as two financial institutions widely viewed as providing benchmark ‘emerging market’ products. Specifically, we include in the screening process any country which falls into at least one of the four following categories: (1) is defined as upper middle income by the UN, (2) is defined as upper middle income by the World Bank, (3) is included in the JP Morgan EMBI Global Index, or (4) is included in the MSCI Emerging Markets Index.
We impose a further requirement, however, that in order to be included in the calculation of the Sustainability Barometer, data must be available for at least 80% of the fifteen sub-indicators that make up the model (see below). Applying this rule means that we excluded twenty-two countries from the end-2022 screening exercise, leaving a total of 110 countries in the analysis.
The themes and sub-indicators
The KBC model is divided into five themes: (1) General economic performance and stability; (2) Socio-economic development of all citizens; (3) Equality, freedom, and rights of all citizens; (4) Environmental performance and commitment; and (5) Peace, security, and international relations. Each theme is sub-divided in turn into three sub-indicators, which are in turn made up of one or more data points (see below). By considering a broad range of sustainability factors, we aim to avoid any tendency towards extremes.4 The selection of the sub-indicators was based, to as great an extent as possible, on composite indicators, which take account of a multiplicity of information from as broad an angle as possible. All the figures are drawn from international institutions (OECD, the United Nations, and the World Bank) or from prominent organisations like the World Economic Forum. In addition to the guaranteed quality of the underlying research, this offers the benefit of consistent availability and ease of international comparison between many countries.
The five main themes and their sub-indicators taken into account in the model are laid out below, including a rough description and an explanation of their significance. A complete, more detailed breakdown of the themes, the sub-indicators and the various data points within them, can be found in the appendix to this report (see below pdf).
Theme 1 – General economic performance and stability
Good and stable macroeconomic performance is the bedrock of a society’s prosperity. Specifically, this means a satisfactory and stable economic growth rate and the absence of imbalances (sub-indicator 1.1). The latter implies the fullest possible utilisation of the labour force (low unemployment), the retention of monetary value (low inflation), and balance-of-payments and public-sector-budget equilibrium. The model measures average real GDP growth over the most recent five years as well as its volatility over that period. Regarding imbalances, we calculate the sum of the unemployment rate, inflation, the deficit on the balance-of-payments current account (as a percentage of GDP) and the public-sector deficit (as a percentage of GDP). Once again, the five-year average is taken into account.
In addition to the current economic situation, we consider the future economic potential (sub-indicator 1.2) and the quality of institutions (sub-indicator 1.3). The first of these relates to the adoption of new technology and research and development efforts, while the second concerns institutions crucial to supporting market-oriented economic activity, such as the protection of ownership rights, the independence of the legal system and effectiveness of government spending. We use the World Economic Forum’s Global Competitiveness Index to this end, more specifically the sub-indices ‘ICT adoption’, 'innovation capability’ and ‘institutions’.
Theme 2 – Socio-economic development of all citizens
In addition to economic performance and stability, governments focus on the socio-economic development of their citizens. The first indicator we consider in this regard is comprised of traditional development benchmarks: per capita GDP, poverty levels and life expectancy (sub-indicator 2.1). This year, we also included undernourishment to help cover UN SDG 2 (zero hunger). A second indicator measures achievements and policy efforts concerning citizens’ education and employment (sub-indicator 2.2). This is based on the participation in, and the level of education (the ‘education and training’ sub-index of the World Economic Forum’s Global Competitiveness Index) and employment relative to population (aged 15+). This year, we added secondary school enrolment and youth unemployment to better round out UN SDG 4 (quality education) and UN SDG 8 (decent work and economic growth).
The second theme also embraces the situation and policy efforts in public health (sub-indicator 2.3). This indicator uses World Health Organisation figures on the number of people employed in the healthcare sector (doctors, dentists, pharmacists, and nurses; per 100,000 inhabitants) and government spending on healthcare (as a percentage of GDP). This year, we added data on the percentage of the population living in slums and access to electricity to better cover UN SDG 11 (sustainable cities and communities) and UN SDG 7 (affordable and clean energy).
Theme 3 – Equality, freedom and rights of all citizens
It is the task of government to limit inequality between citizens, but also to provide them with liberties and rights to enable their personal development and their ability to take initiatives. Inequality between citizens is measured by income inequality, specifically using the GINI coefficient (sub-indicator 3.1). To sub-indicator 3.1, we added a gender inequality index in order to reflect UN SDG 5 (gender equality). In the case of political rights and civil liberties, we draw on the World Bank’s Governance indicators, specifically that for ‘voice and accountability’ (sub-indicator 3.2). This brings together all traditional rights and liberties (freedom of speech, religion, press, travel, etc.). Specific attention is paid to the freedom and ease of carrying out an economic activity (sub-indicator 3.3). This is measured by the ‘ease of doing business’ index of the World Bank’s ‘Doing Business Report’.
Theme 4 – Environmental performance and commitment
The model also takes account of progress in environmental quality (air, water, biodiversity, etc.) and reducing pressure on the environment (waste reduction, combating the depletion of raw materials, etc.). We focus on three aspects within this fourth theme: environmental performance, ecological footprint, and climate change. The first of these is measured by the Environmental Performance Index published by the universities of Yale and Colombia (sub-indicator 4.1). This is made up of benchmarks for environmental pollution, biodiversity, forest management, overfishing, etc. The second aspect is measured using the Ecological Footprint score published by the global footprint network (sub-indicator 4.2). This figure indicates how large an area of biologically productive land and water a population group requires in one year to maintain its level of consumption and process its waste production. We measure climate-change aspects using the Climate Change Performance Index published by Germanwatch and the Climate Action Network Europe (sub-indicator 4.3). This index compares the progress made in terms of climate protection by countries that are responsible for 90% of carbon emissions.
Theme 5 – Security, peace and international relations
The final theme focuses on the existence and achievement of peace and security, and on international relations between countries. Peace and security are amongst citizens’ most important basic needs and are simultaneously essential preconditions for economic prosperity. To measure them, we use Vision of Humanity’s Global Peace Index (sub-indicator 5.1), which maps existing conflicts and measures insecurity based on, for example, the number of murders and assaults, and how easy it is to purchase weapons.
There are two dimensions to measuring international relations between countries. The first concerns the degree to which countries are signatories to international treaties (sub-indicator 5.2). The second is the degree to which countries have open borders (sub-indicator 5.3). The first of these is measured with reference to the status of ratification of important international treaties (primarily those relating to fundamental human right, labour rights, and environmental agreements). We measure the second using the KOF Institute’s Index of Globalisation, which takes account of economic, social and political globalisation. As we are now measuring emerging and advanced economies together, we no longer consider the degree to which countries have committed to development aid, as this indicator is not relevant for developing economies.
The rating calculations
There are three stages to arrive at a score for each country based on these five themes. We begin at the sub-indicator level, specifically for sub-indicators comprised of various data series. Each series is standardized so that the best performing country gets a standardized score of one and the worst performing country gets a score of zero. In the second stage, the series are then averaged together, giving equal weight to each series, and thus providing us with a score for that sub-indicator (the exception is sub-indicator 1.1 ‘macroeconomic performance & absence of disequilibria’, where ‘disequilibria’, which is made up of several data points is given a 50% weighting compared to 25% each for ‘GDP growth’ and ‘volatility of economic growth’). Sub-indicators based on a single data series are simply standardized from zero to one.
The third stage then moves to the theme level. The values for each sub-indicator, calculated in the previous step, are averaged together (again with equal weighting) and then standardized to a value between zero and one. The best performing country again gets a value of one and the worst performing a value of zero. If a value for one of the sub-indicators is missing, the raw theme score is calculated without that sub-indicator. Notice that, if a country has data for less than 80% of all sub-indicators considered - i.e., if three or more of the fifteen sub-indicators are missing - then the country is excluded from the calculations.
Screening results
KBC Sustainability Barometer: update 2023
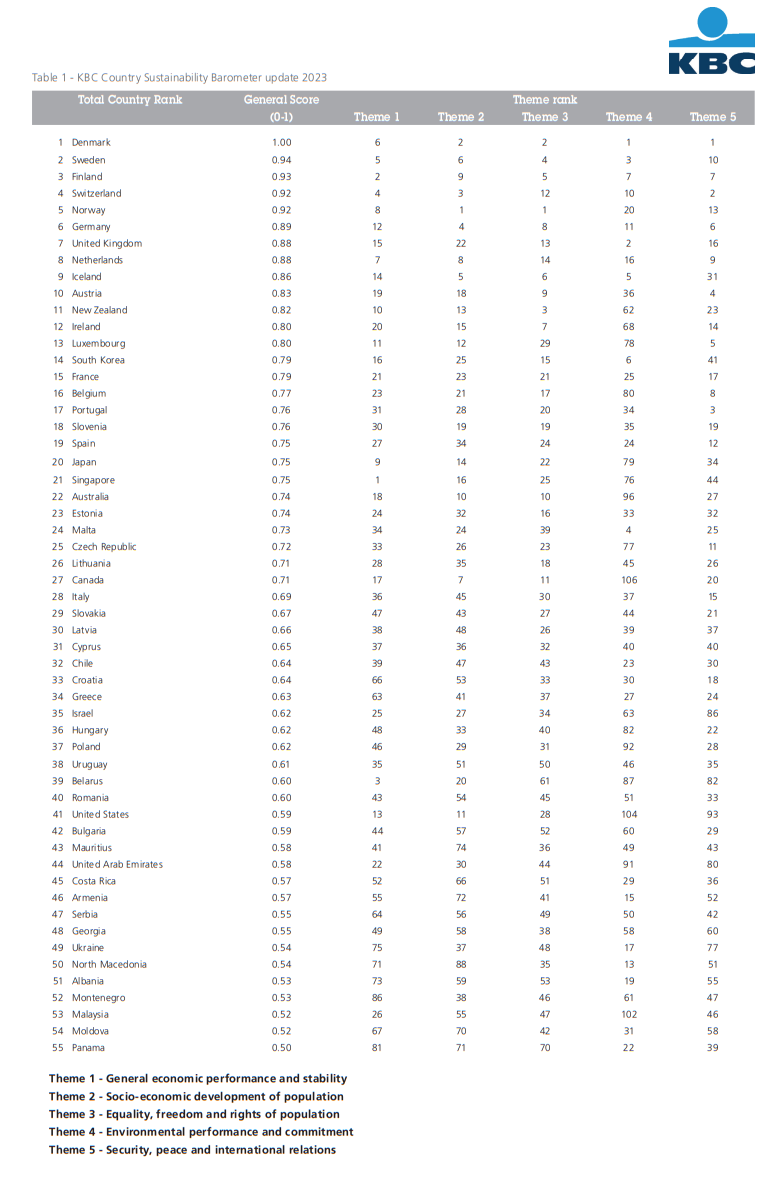
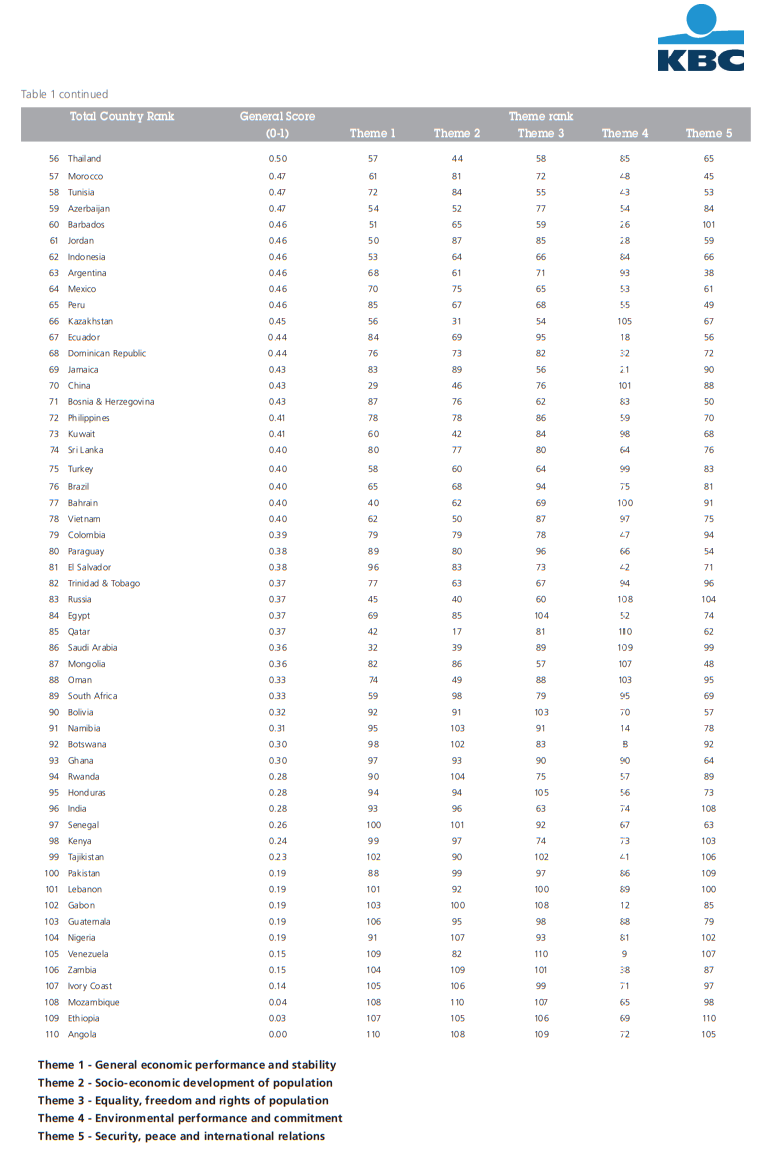
Denmark, Sweden and Finland occupy the first three places respectively in the general country ranking of the KBC Sustainability Barometer. Switzerland and Norway also score very well, taking the fourth and fifth place respectively. While comparisons with last year’s results are complicated by the fact that we now group advanced and emerging economies together, these five countries ranked in the top five of the advanced markets ranking last year as well. The Scandinavian countries and Switzerland convincingly demonstrate that economic, social and ecological performance and policy goals need not conflict with each other, but can, on the contrary, reinforce one another. These countries have been at the top of the country ranking since the start of KBC's screening exercise in 2002.
In general, advanced economies outperform emerging economies in the ranking. The highest-ranking emerging market economy (according to the above-defined classification) is the Czech Republic, at 25th place, though other peer economies with similar GDP-per-capita ratios, such as Slovenia and Estonia, rank 18th and 23rd, respectively. In general, the Central and Eastern European economies perform well relative to the other emerging markets, as was also the case in previous rankings.
Belgium ranks 16th out of 110 countries, after also ranking 16th in last years screening against only the developed economies, suggesting a stable performance. The country scores best (8th place) for Theme 5: ‘Security, peace and international relations.” However, it scores particularly poorly (80th) in Theme 4: ‘Environmental performance and commitment.’ This poor performance is particularly a result of a low ranking in the Ecological Footprint Indicator, which highlights Belgium’s high level of carbon emissions per person. More detail on Belgium's performance in the country ranking can be found in a KBC Economic Opinion published together with this Research Report. Belgium is not alone in scoring well in Themes 1, 2, 3 and 5, but poorly in Theme 4, especially among advanced economies. Among the top 20 ranked countries, New Zealand, Ireland, Luxembourg, and Japan all show a less-than-stellar performance in environmental sustainability, suggesting significant room for improvement.
1 The results of the updated KBC Country Sustainability Barometer will be integrated into KBC's Responsible Investing funds later this year
2 This definition is in line with the concept of sustainable development as first put forward by the Brundtland Commission (see WCED, 1987).
3 See KBC Economic Bulletin no. 26 (2015) for a survey and detailed analysis.
4 Care was taken when selecting the sub-indicators to avoid excessive correlation between them.
The appendix you can find here pdf