Emerging Markets Quarterly Digest: Q4 2022

Content table:
Read the publication below or click here to open the PDF.
Suffering through a deteriorating environment
In the last edition of this publication, we noted that the stage was set for emerging markets to face several difficult months ahead. We also noted, however, that signs of distress signalling an impending systemic crisis among emerging markets were so far limited. In the months since, the external landscape has only deteriorated further. Inflation remains stubbornly high, particularly in major advanced economies, and expectations for the pace and endpoint of Fed policy tightening have risen further. Meanwhile, the recovery in China from its lockdown-induced contraction was not enough to suggest a meaningful acceleration of momentum, with headwinds to a stronger recovery mounting. All this points to an even more complicated landscape for emerging markets. However, while we have already seen several smaller (often low-income or less developed) economies turn to the IMF for assistance, signs of a broader crisis still remain limited. It therefore becomes increasingly important to differentiate between types of emerging markets when discussing existing vulnerabilities, both by and within regions.
Fed rate hiking cycles: a classic conundrum
Fed policy hiking cycles often result in market turmoil for emerging markets. Higher interest rates in advanced economies induce investors to rebalance their portfolios away from riskier, high-yielding emerging market assets, leading to lower (or often a reversal in) capital flows. Economies with high external imbalances, such as large current account deficits or significant external debt levels, may need to dip into their foreign exchange reserves to cover the reduced capital flows and rebalance internally (i.e., reducing the current account deficit through lower consumption and drastically cutting government spending). The situation can be exacerbated by a strong US dollar, which can lead to a sharp depreciation of the domestic currency, worsen external liabilities denominated in foreign currency, make imports more expensive, and contribute to higher inflation. Economies with more extensive vulnerabilities, such as insufficient FX reserves or surging risk premia that essentially lock them out of capital markets, may even find themselves facing a debt default, as was the case with Sri Lanka earlier this year and could soon be the case for Ghana as well.
Not all Fed tightening cycles are the same, however. When the Fed is tightening into a period of economic strength, for example, that strength can spill over to emerging markets and offset (some of) the pain of the tighter financial conditions. Currently, however, given the energy crisis, the inflation shock, and the problems plaguing China’s economy, the Fed is tightening into a landscape of deteriorating global and regional growth. The result is an even more complicated situation for nearly all economies, both emerging and advanced alike.
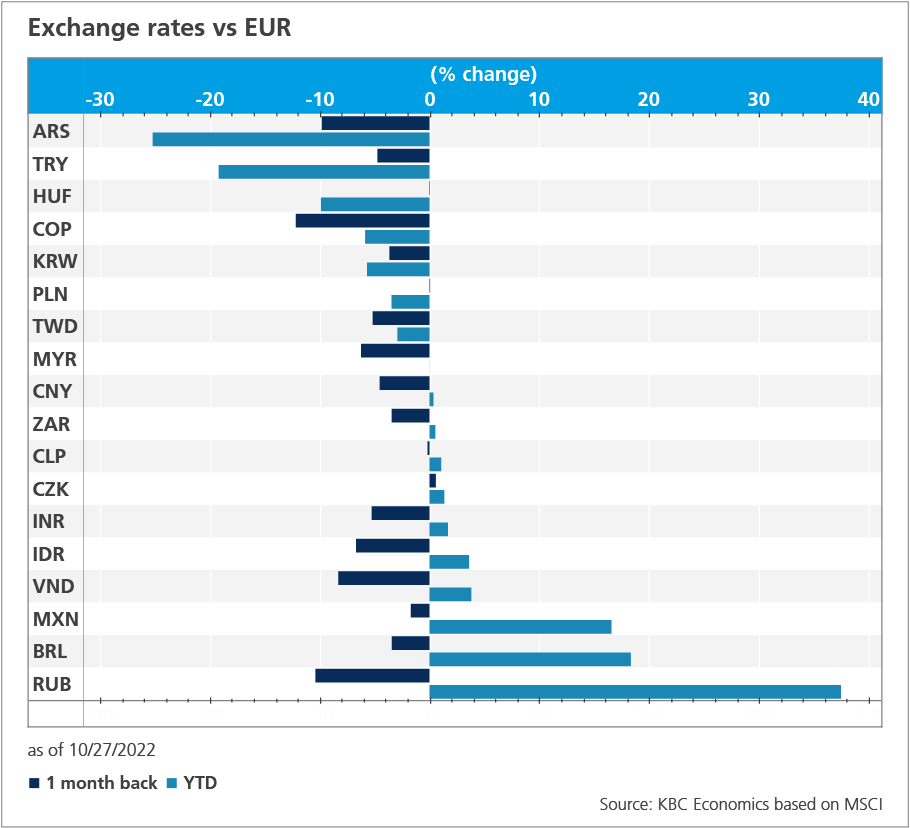
EM assets suffer, but so do others
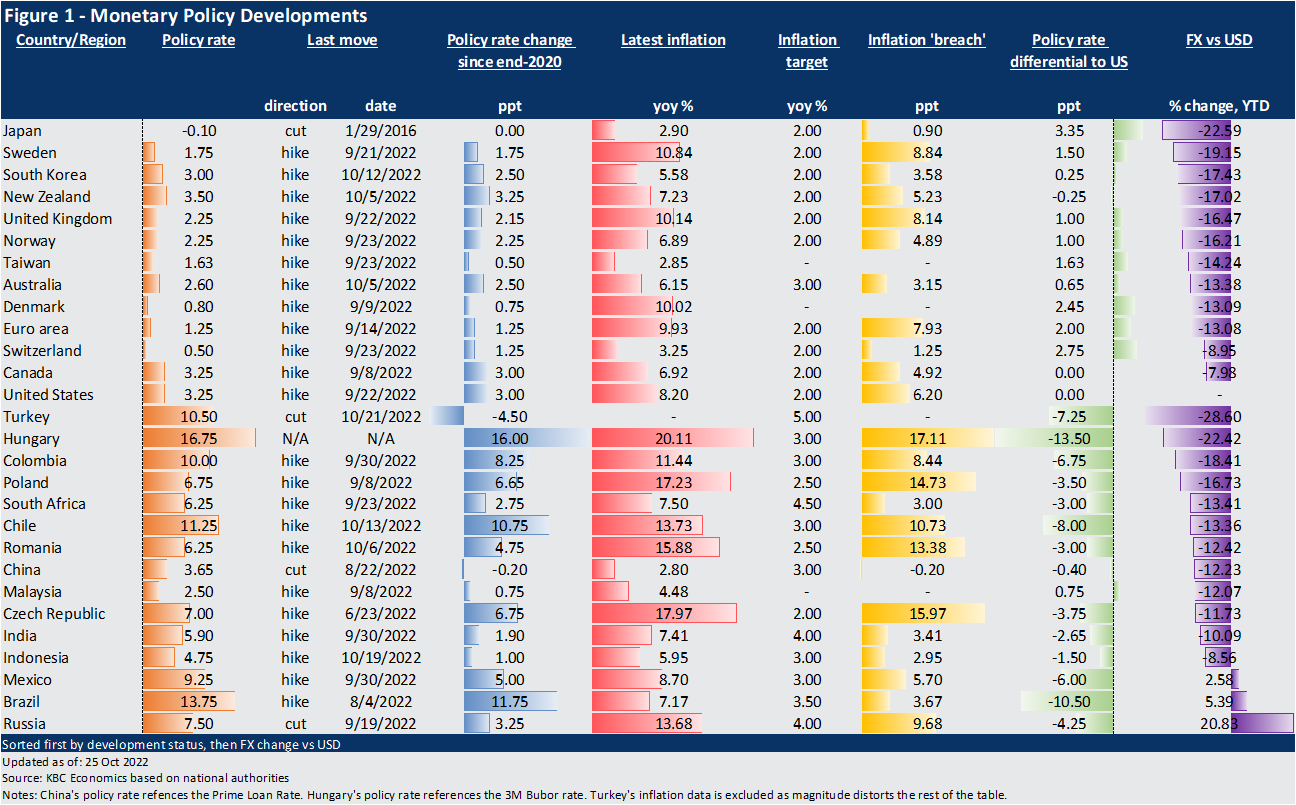
It is no secret that emerging market assets have suffered this year. Nearly all emerging market currencies have depreciated vs the US dollar year-to-date (BRL and MXN are two notable exceptions aside from the very idiosyncratic case of the Russian rouble), with some depreciating significantly; as of 23 October, the Turkish lira is down 28%, the Hungarian forint is down 22% and the Polish zloty is down 17% while the exchange rates of frontier economies that have sought or are seeking bailouts from the IMF have fared even worse (the Ghanaian cedi is down 55% and the Sri Lankan rupee is down 44%). But what is striking when looking at exchange rates across the board, is that many of the major emerging market currencies have performed better against the dollar than a number of advanced economy currencies this year—notably the Japanese yen (-23%), the Swedish krona (-19%), the New Zealand dollar (-17%), the Norwegian krone (-16%), the British pound (-16%) and the euro (-13%). This may reflect the fact that policy interest rate differentials versus the US remain wider in advanced economies, which were generally slower to start hiking interest rates vis-à-vis emerging markets (figure 1).
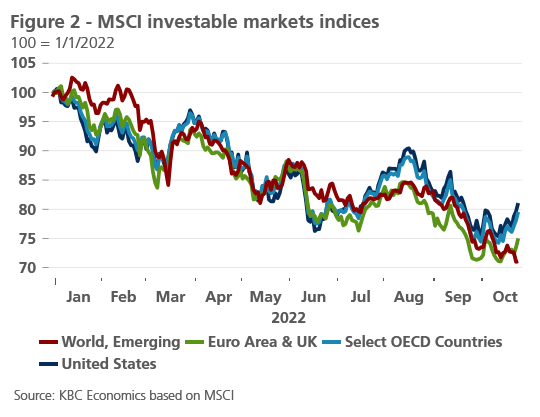
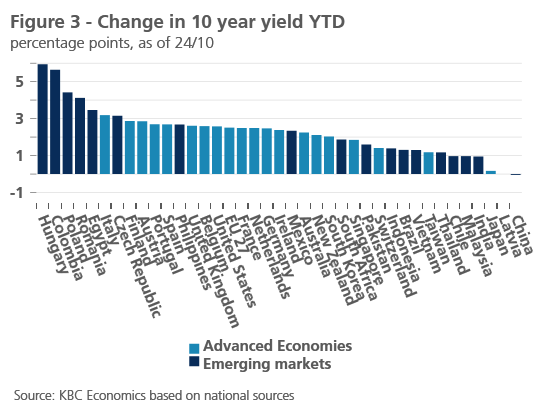
A similar development is seen when looking at equity and government bond markets. The MSCI USD emerging market IMI index is down 25% over the past 10 months. But advanced economy equities are down too (US: -19%, Euro area and UK: -25%) (figure 2). Emerging market government debt has also performed poorly, with the JP Morgan USD EM bond ETF down 26% year-to-date through 24 October. But emerging market government bonds are far from alone in seeing a selloff. US government 10-year yields are up 2.7 percentage points year-to-date (through 24/10). Among the major emerging markets, there are certainly some that have seen a more pronounced rout in their respective bond markets (such as Colombia, Hungary and Poland), but for many emerging markets, the rise in the yield on 10-year government bonds this year has been less than that of the United States and other advanced economies, actually suggesting a declining spread (figure 3). While, overall, the interest rates on emerging market government bonds are still generally much higher than those of advanced economy counterparts, the lack of a sharp increase in spreads during the Fed rate hiking cycle suggests a limited increase in risk premia despite the more difficult environment.
This, however, does not mean all emerging markets are in the clear. Already a number of frontier or low-income economies have turned to the IMF and other creditors for assistance or a debt restructuring. This is where it becomes increasingly important to differentiate between different types of emerging markets. We at KBC Economic Research tend to focus on a smaller subset of large emerging markets in our analysis (which can be referred to as ‘major’ emerging markets), as they are typically more integrated into the global financial system, and developments in these economies can have implications for the global economy as a whole. Indeed, frontier markets and low-income economies are generally less well represented in emerging market indices like those mentioned above. However, it should be stressed that just because a crisis in a frontier economy may be less likely to tip markets into a broader, systemic situation, such crises are still very important from a social and developmental point of view and pose important questions for local policymakers and international institutions (see box for more details on the distinction).
Box: Frontier markets versus major emerging markets; differences in definition and vulnerabilities
Emerging markets is a term with no fixed meaning or definition, and yet it is used every day by economists, investors, reporters, policymakers, and institutions to categorize a large swathe of the global economy. Every few months, and especially in times of rising interest rates and a strong US dollar, a trove of analyses and news articles are published warning that emerging markets might be headed for a crisis. But with no precise definition of what constitutes an emerging market, and vast differences between the economies grouped together as such, often these discussions can trigger at best confusion and at worst unwarranted panic. Therefore, it can be useful to talk of developing or emerging markets in general, and within that category make a distinction between major emerging markets and frontier economies. Given the rising tempo of crises facing the world economy (from pandemics, to inflation, to energy crises, to climate change), clarity when discussing emerging markets is now more important than ever.
In our annual update of the KBC Sustainability Barometer, we note that emerging markets “are generally characterised by strong inflows of foreign direct investment, a high degree of industrialisation and substantial openness to external international markets… Emerging markets are also often characterized as countries focused on improving their infrastructure and institutions, including their financial, social, and political systems. As a result, such countries are often in a major state of transition, with prosperity levels (per capita GDP) that, while rising rapidly, are usually lower – and significantly so in some cases – than those in developed countries. Such transitions are not always smooth or gradual, however, which means the country’s economic performance can be volatile and associated with higher levels of risk.”
From this broad and very generalized description, we can pull out some criteria used to classify such countries. The first that comes to mind is income per capita, with high-income economies generally seen as developed or advanced. But there are also important distinctions to be made between, e.g., low-income economies and upper-middle income economies, which is where the general grouping of emerging markets becomes trickier. The IMF classifies countries into developed, transition, and developing economy groups, as well as into four income groups.1 Based on these classifications, there is a clear link between income and development status, but it is not one-to-one. For example, with the exception of Bulgaria, all developed economies are also high-income economies (but not all high-income economies are developed), transition economies are mostly upper-middle-income economies, and the “least developed” economies within the developing economy group are generally low-income or lower-middle-income economies. But within the larger category of developing economies, there is a mix of low, lower-middle, upper-middle, and even some high-income economies.
To differentiate between these very different country groups within the category of developing economies, we must also think of the other factors mentioned above, such as openness to international markets or foreign investment, and improving infrastructure and institutions. In this case, it can be useful to turn to financial institutions that assess features like market accessibility and liquidity on behalf of investors. MSCI, e.g., classifies economies into developed, emerging, and frontier markets based on three criteria: GNI per capita, size and liquidity of market, and market accessibility. Importantly, they note that GNI per capita level only matters for determining developed market status and is not used to distinguish between emerging and frontier economies. This results in a narrower set of 25 emerging market economies and a separate set of 21 frontier economies, where frontier economies have even more limited accessibility and liquidity compared to emerging markets.2 JP Morgan’s flagship emerging market bond index (EMBI Global), on the other hand, doesn’t distinguish between emerging and frontier economies, but those smaller, less accessible, and less liquid markets have a much smaller weight in the index.3
Differentiating between developing economies in this way is useful for several reasons. Of course, it is important to stress that from a social and development point of view, crises in all developing markets are significant and should be a major concern for global leaders and policymakers. This is especially true nowadays, when China has become the world’s largest creditor, largely to low-income, frontier economies, miring global debt statistics in a lack of transparency and raising concerns about how China might work with other creditors when sovereign debt defaults arise.
But a crisis in a major emerging market that is more integrated into the international financial system is more likely to have a significant market impact globally with important spillover risks to other emerging markets or the world economy as a whole. Crises in lower-income or frontier markets also carry this spillover risk, but to a much smaller extent. Similar arguments can be made for crises in economies with well-documented, idiosyncratic economic or financial market problems. Investors should be well aware of the higher risk associated with such assets, and increased turmoil there shouldn’t necessarily lead to a change in investor sentiment toward emerging markets as a whole.
In the present context, the distinction is crucial. Emerging market economies currently face important headwinds given high debt levels, rising interest rates, a strong US dollar and high inflationary pressures. Furthermore, the recent IMF bailouts or bailout discussions for at least three emerging markets (Sri Lanka, Zambia and Ghana) have made headlines and raised the spectre of concern about emerging markets overall. At the same time, it is important to keep in mind specifics about these economies. All three are lower-middle income economies, classified as either frontier markets (Sri Lanka) or not classified (Zambia and Ghana) by MSCI, and have very small weights in the EMBI global (Ghana 0.56%, Sri Lanka 0.28%, and Zambia 0.14%). On top of this, each economy faces its own specific challenges that contributed to the need for a bailout.
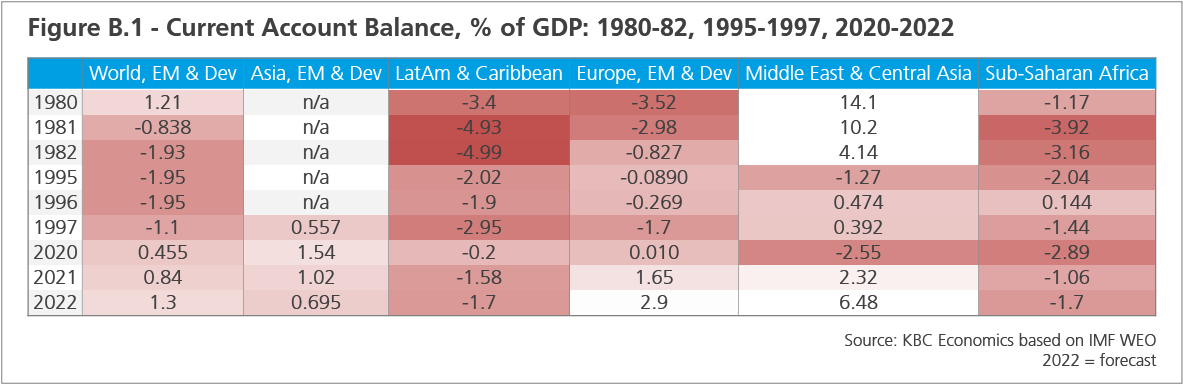
For major emerging market economies, the situation is somewhat different. Current account deficits have generally widened this year given the energy and food price shocks, but still remain more manageable compared to where they were during the crises of the 1980s (Latin America) or 1990s (emerging Asia) (figure B.1).
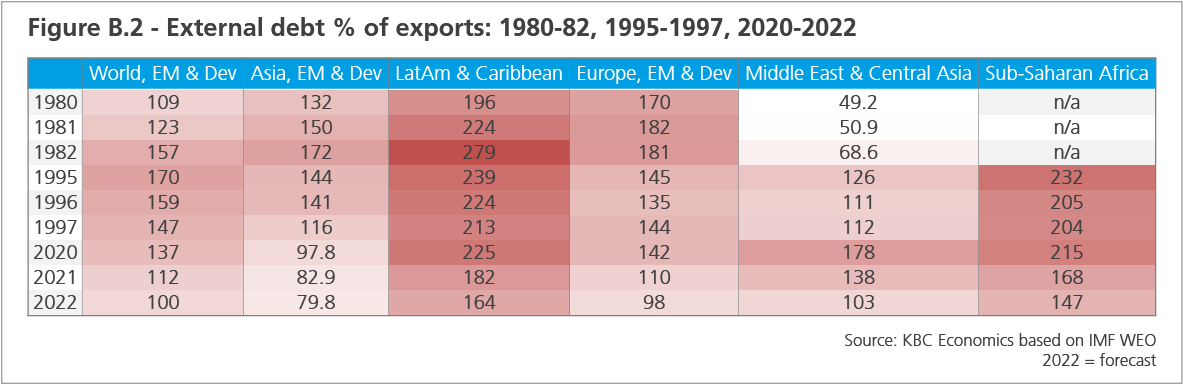
The same is true for external debt relative to exports (figure B.2). Meanwhile, reserve coverage relative to external debt is also largely adequate according to IMF standards (fully covering short term debt). On top of these fundamentals, major emerging market central banks have been quick to respond to the inflation threat and started hiking already in 2021.
Hence, while it is true that the current macroeconomic landscape is anything but friendly—particularly for lower-income economies dealing with a heavy debt load on top of sky-high inflation—an IMF bailout for one developing economy does not necessarily mean a crisis is coming for all developing economies. Specificity when discussing emerging markets is, therefore, more important now than ever.
1. World Economic Situation and Prospects 2022 (un.org)
2. Market Classification - MSCI
3. JP Morgan EMBI Monitor September 2022
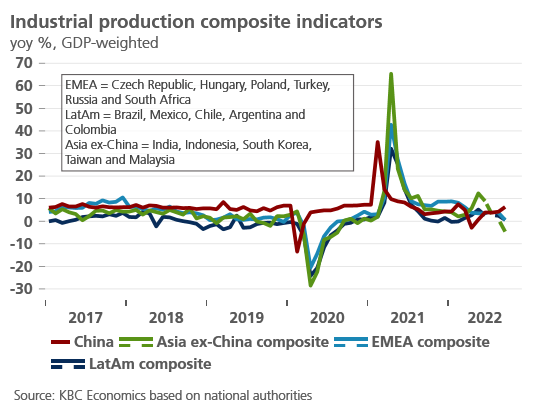
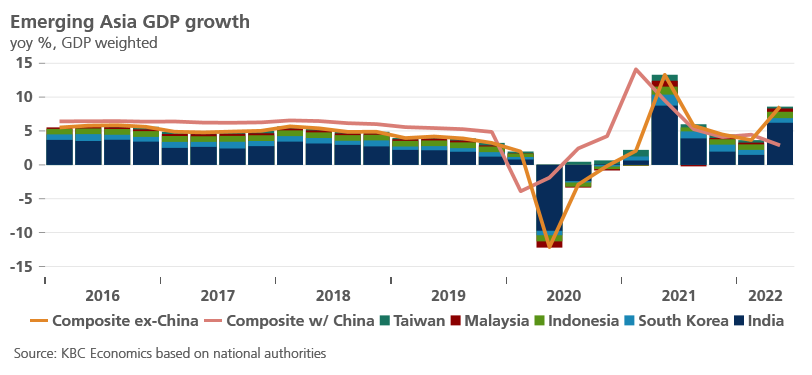
Emerging Asia
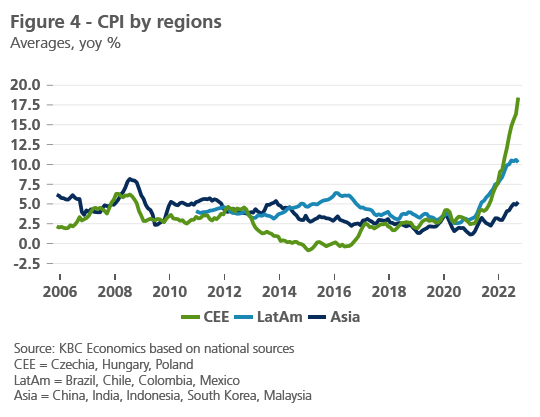
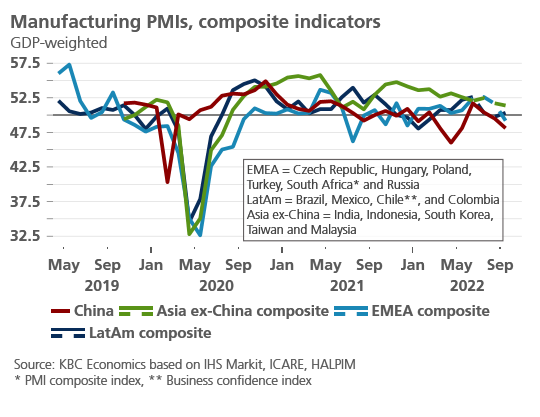
External economic developments are playing an important role in many Asian economies at the moment. Export growth continues to trend down as external demand slows in advanced economies like the US and euro area. But the economic malaise in China plays an outsized role in the region given strong trade links (exports to China account for over 20% of total exports for Vietnam, Indonesia, Thailand, Malaysia, and the Philippines). Uncertainty regarding the strength of the recovery in China going forward, and rising risks of a further deterioration in activity cast a shadow over the outlook in the region. Indeed, business sentiment surveys for the manufacturing sector (Markit PMIs) have slipped below 50 in China, Malaysia, and South Korea. In addition, the swift pace of policy tightening by the Fed and by other advanced economy central banks is putting pressure on central banks in the region to also lift policy rates, though inflation generally remains more subdued there compared to elsewhere in the world (figure 4). Some Asian central banks started hiking already back in spring 2022 (such as in the Philippines and Malaysia), while others started only in August or September (Thailand, Vietnam, Indonesia). But generally, the magnitude of policy tightening has so far been lower than elsewhere in the world.
China
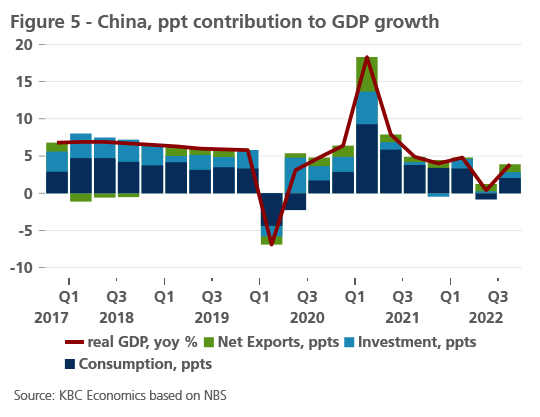
The Chinese economy continues to be mired in uncertainty and mounting risks. An unexplained delay in the release of third quarter GDP data, in addition to several other economic indicators, raised concerns over the strength of the recovery in the third quarter. The eventual release of the data shows the economy did indeed rebound from the contraction in the second quarter, with growth of 3.9% quarter-over-quarter (equivalent to 3.9% year-over-year) (figure 5). While the third quarter figure was somewhat stronger than expected, the data does little to allay concerns over the future trajectory of China’s economy.
Problems in the real estate sector and the shadow cast by an unrelenting zero-covid policy are the main short-term factors weighing on growth. As expected, the CCP National Congress last week did not herald any imminent change to this policy despite its fall-out of keeping Chinese GDP well below target (and potential). The outcome of the party congress seems to have raised additional concerns as well, with Xi Jinping not only securing an unprecedented third term as president, but also cementing power via loyalist appointments in key seats within the party and revisions to the constitution. This outcome helps erode remaining checks and balances within the government, potentially raising the risk of future policy mistakes at a time when policy decisions will have a significant impact on China’s medium-term macroeconomic outlook. Furthermore, from a policy perspective, there was a recommitment to the common prosperity agenda that favors redistribution and regulatory crackdowns over headline GDP performance.
We therefore maintain a conservative outlook on China’s growth performance in the coming quarters despite the slightly better than expected Q3 data. Consumer confidence remains abysmally weak while business sentiment indicators are trending sharply down (with the Markit PMIs suggesting contractions in both manufacturing and services in September). As a result, the acceleration in industrial production (0.84% month-over-month) and retail trade (0.43% month-over-month) in September, while key reasons for the stronger-than-expected Q3 GDP figure, are not yet enough to establish a stronger trend in underlying momentum. Annual GDP growth for 2022 may well end up above the 3.0% we currently forecast, but risks are growing that 2023 annual GDP growth will be weaker than the 5.2% we currently have penciled in.
India
India’s economy faces similar trade offs to many emerging markets at the moment. High inflation, together with tighter monetary policies externally and a weak currency versus the dollar, puts pressure on the Reserve Bank of India (RBI) to continue hiking the policy rate despite important growth headwinds. After recording sequential quarterly growth of only 0.01% in Q2 (which, due to base effects, coincided with a strong year-over-year growth rate of 13.5%), data available so far for the third quarter is somewhat mixed. The RBI’s business survey index decelerated from 110.1 in Q2 to 106.7 in Q3, while the PMI for the services sector fell consecutively in July, August, and September to 55.7. The manufacturing PMI, however, improved over that time horizon (to 55.9) while the consumer confidence survey on the current situation continued to climb to 80.6 (which is still relatively weak compared to the pre-covid average). Industrial production, meanwhile, continues to trend down and contracted 0.83% year-over-year in August, suggesting that while growth likely recovered somewhat in the third quarter, there remain significant headwinds to stronger momentum. We forecast average GDP growth of 7.0% for FY 2022-23 and only 4.3% for FY 2023-24.
Meanwhile, some uncertainty over the path of domestic inflation complicates the outlook for the RBI. After reaching 7.4% year-over-year in September, headline inflation should ease in the coming months due to sizable base effects. However, core inflation is trending up, and at 6.1% year-over-year, is still well above the RBI’s 4% target. Furthermore, volatile food prices could contribute to rising inflation expectations, with the risk of inflation becoming unanchored. In addition, the INR has depreciated 10% versus the US dollar year-to-date. While this by no means makes INR one of the worst performing currencies this year, it can still contribute to inflationary pressures. As a result, the RBI is likely to continue with additional rate hikes in the coming quarters. We currently forecast a terminal rate of 6.75% by Q1 2023.
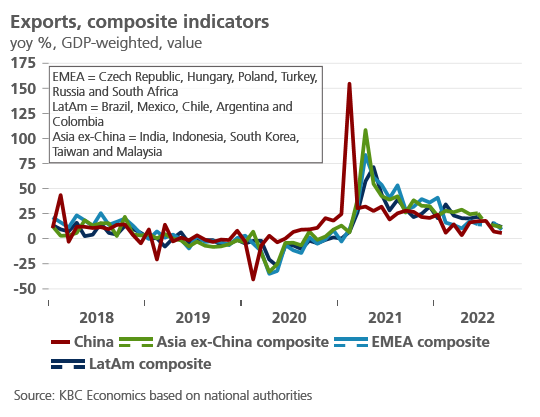
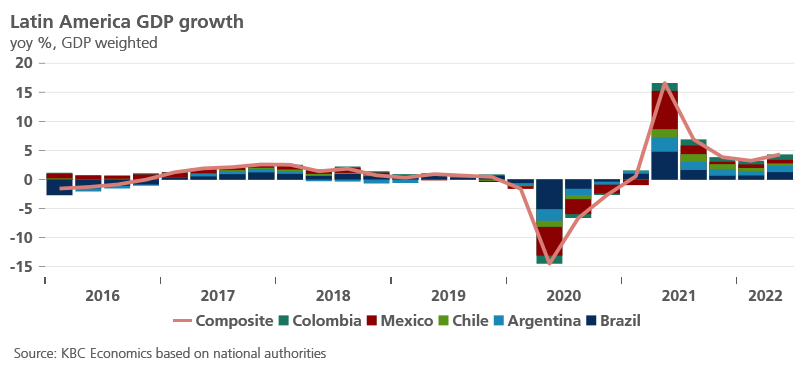
Latin America
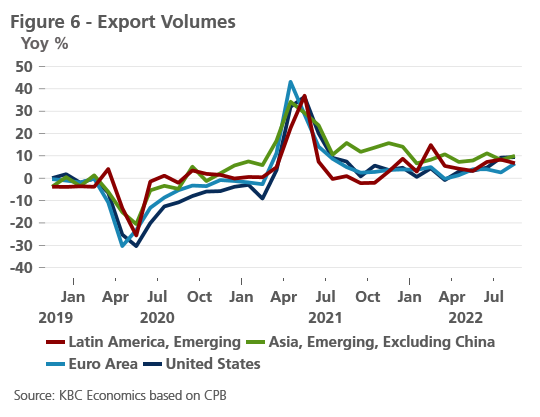
Latin American economies face a difficult environment as well, yet some larger economies in the region appear to be muddling through better than many emerging market peers. On the growth side, export volumes are holding up well and even improving despite the global growth slowdown (figure 6). Still solid growth in the US in the 3rd quarter – a major trading partner for regional economies including Mexico and Brazil – may be behind this strength. This suggests, however, that an expected slowdown in the US in the coming quarters may weigh on growth in the region going forward. Business sentiment surveys, meanwhile, show a mixed bag, with manufacturing PMIs above 50 and improving in Brazil and Mexico, and above 50 but decelerating in Colombia. Meanwhile, Chile faces a more dire situation, with a sharp deterioration in the current account balance (to -8.8% of GDP) and a coinciding depreciation of the peso. The widening current account deficit is a result of excess spending (both public and private) through the pandemic followed by the decline in many commodity prices aside from energy prices. A sizable slowdown of the economy is therefore likely necessary to bring the current account back to sustainable levels once more.
Mexico and Brazil are two of the rare economies with currencies that have appreciated versus the US dollar year-to-date. There are a few reasons for this. First, inflation, while still high at 7.2% year-over-year in Brazil and 8.7% year-over-year in Mexico, is elevated but less so than in many other emerging markets (particularly those in Central and Eastern Europe). Furthermore, in Brazil, headline inflation has been trending sharply lower over the past 3 months reflecting monthly declines in energy prices. More importantly, however, central banks in Latin America, including in Brazil and Mexico, have been quick to raise rates sharply above neutral in response to the inflation (and Fed) threat. In fact, of the major economies worldwide, aside from China, Brazil and Mexico are the only economies where the current policy rate (9.25% in Mexico and 13.75% in Brazil) is above the latest inflation print (see again figure 1). Given that inflation is still trending up in Mexico, more policy rate hikes are expected from Banxico. For Brazil, however, the COPOM has likely reached the end of its hiking cycle, barring any major new shocks.
Brazil also faces potential policy changes as a result of the presidential runoff that will be held on 30 October. Leftist former President ‘Lula’ da Silva has a slight lead in the polls against far-right incumbent Jair Bolsonaro. Neither candidate is an unknown when it comes to leading Brazil’s government. A win by Bolsonaro would likely mean a continuation of often controversial free-market policies (though currently bolstered by last-minute welfare spending), while a win by Lula would see a return to the socialist policies he promoted during his previous terms.
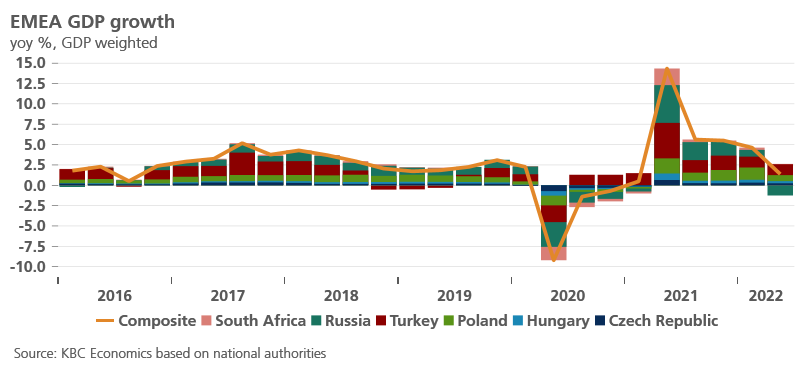
EMEA
Central Eastern Europe
Central Eastern European (CEE) economies are currently in a particularly difficult situation. Inflationary pressures are on average stronger than in the rest of the EU or compared to emerging markets elsewhere, there is a very high dependence on natural gas imports from Russia that is difficult to break (in 2021, Russian gas imports accounted for almost half of CEE consumption), and the potential negative market effects of a further escalation of the Russia-Ukraine conflict are severe.
Reduction of gas consumption will therefore be crucial to counter the Russian gas cut-off, not only in the 2022/23 winter season but also with the winters that follow. By the beginning of October, in the CEE region, the gas storage fill rate had reached 83% on average, with the highest figure recorded in Poland (98%) and the lowest in Latvia (53%). However, voluntary gas saving can also significantly contribute to successful management of the energy crisis. A simple calculation based on real historic data suggests that the need for savings in gas consumption in the Czech Republic is significantly higher than in Slovakia, even though the current level of filling of gas storage tanks is comparable in both countries (87% vs. 89%). Although the Hungarian tanks are significantly less filled than the Czech ones (75% vs. 87%), the need for reduction in consumption is nevertheless noticeably lower. And the greatest reduction in consumption would be desirable in Bulgaria, even if the reduction in cross-border gas flows would be less than half.
The high dependence on gas explains to a large extent why CEE economies are expected to underperform in 2022 and 2023. In CZ, we only expect 2.1% growth in 2022 and 0.8% growth in 2023. In Hungary, growth is expected to be 0.0% in 2023, down from 5.5% in 2022. Non-disbursement of NGEU funds could drive our forecast even lower. Both economies are also under heavy inflationary pressure, with 2022 inflation expected to reach 13.9% in both countries.
Inflation in 2023 is also expected to remain elevated. Meanwhile, the ECB’s monetary policy stance is also far too loose for both Slovakia and Bulgaria, with inflation expected to be in double digits in 2022 and, for Slovakia, also in 2023. We also expect growth to be low in both economies in 2023, with Slovakia growing at 0.6% and Bulgaria at 1.6%. For more detailed analysis see: Perspectives Central and Eastern Europe (kbc.com).
Turkey
Turkey’s economy and markets continues to be rocked by unorthodox policymaking. Despite inflation reaching 83.4% year-over-year in September, the CBRT recently cut its policy rate by 150bps to 10.5%, a clear prioritization of growth over price stability. Communications released alongside the decision suggests that another round of easing is likely at the next meeting. With real rates deeply negative, it is no surprise that the Turkish lira is down over 28% against the USD year-to-date. And yet, the FX market and bond market in Turkey have become somewhat disconnected from Turkey’s actual macro-environment due to various interventions and regulations, with the most recent dovish central bank communication hardly causing a move in the currency and with the yield on Turkey’s 10-year government bond down sharply this year. Pro-growth unorthodox policies are likely to continue in the run up to elections in 2023 but are not sustainable in the long run.
South Africa
South Africa’s economy continues to muddle through the difficult economic environment, being neither one of the best performing nor worst performing major emerging markets this year. GDP growth contracted 0.74% quarter-over-quarter in Q2 and is likely to have registered near-flat growth in the 3rd quarter. Mining output was up 0.64% in the three months through August versus the previous three months. Manufacturing, meanwhile, was up 2.1% month-over-month in August after a minor contraction (-0.11%) in July. However, power shortages and weak business sentiment surveys (the composite PMI declined to 49.2 in September) raise the risk of a weak end to the quarter, potentially tipping growth into negative territory. Elevated inflation also presents an important headwind to consumption, though the headline figures has declined the past two months to 7.5% year-over-year, and the core inflation index is only slightly above the central bank’s 4.5% target at 4.7%. With a policy rate currently at 6.25%, however, we expect further rate hikes to eventually bring the policy rate to 7.5% in early 2023.
Tables and Figures
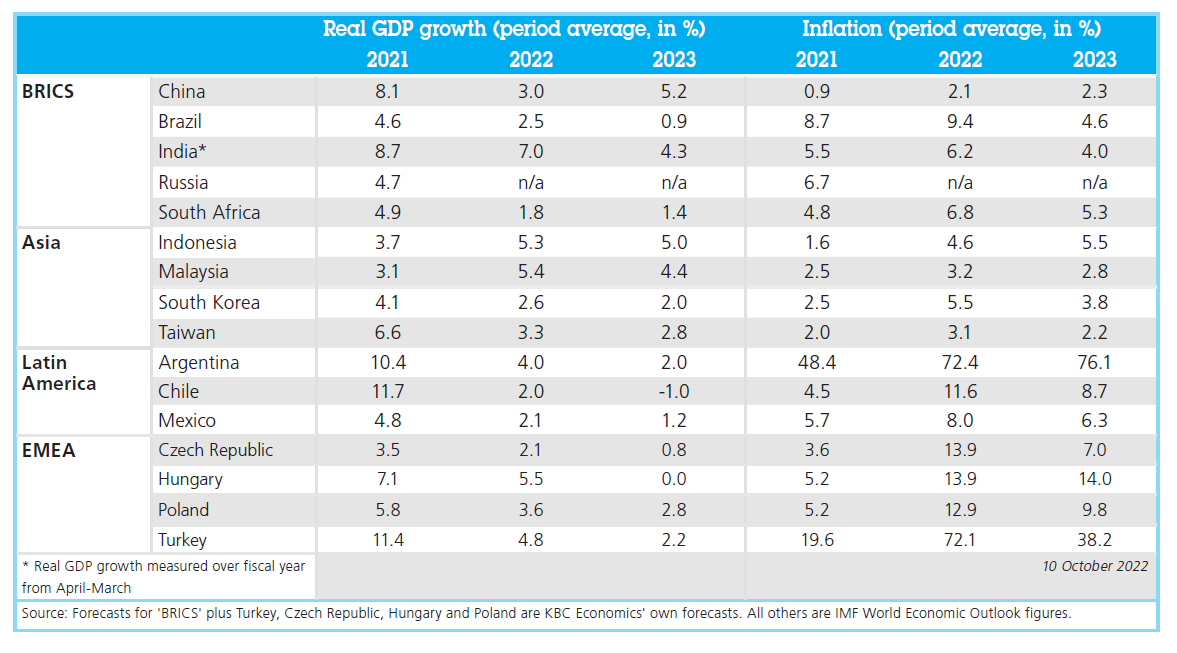
Outlook emerging market economies
Note: forecasts are those prevailing on 10 October 2022