

Emerging markets: resilience in a chaotic world


Read the publication below or click here to open the PDF.
The year so far has been a story of remarkable economic resilience amid chaotic policy shocks and elevated geopolitical risks. This is especially true for emerging markets, which are typically highly vulnerable to heightened external uncertainty, trade disruptions and market volatility. But despite the extreme uncertainty injected into the global economy this spring, when President Trump first revealed his so-called Liberation Day tariffs, emerging market economies have not spiraled into a crisis and, far from it, appear, at least on the surface, to still be on solid footing from a macroeconomic perspective. Some of this reflects the subsequent scaling down of the more eye-popping tariff rates together with a depreciating dollar through the first half of the year, but emerging market macroeconomic policy stances together with a shift in some major emerging markets towards more services-oriented economies also play an important role.
This is not to say that emerging markets have completely shrugged off Trump’s trade shock. Indeed, much of the strong growth recorded by emerging markets at the beginning of this year reflected solid export growth due to temporary pre-emptive imports from the US ahead of tariffs coming into effect. Furthermore, though Q3 growth figures are not yet available for most economies, a growth slowdown among emerging markets is expected through the end of 2025 and early 2026. And certain economies and regions remain more vulnerable to trade shocks than others, especially less developed economies and those with significant trade links to the US. Varying tariff levels (with tariffs on imports from China, Mexico, South Africa, Brazil and India being particularly high) and exposure to sector-specific tariffs play a role as well. As such, risks are heavily tilted to the downside, even if the resilience of emerging markets on both the macroeconomic and financial market fronts has been remarkable so far.
Export exposures and strength
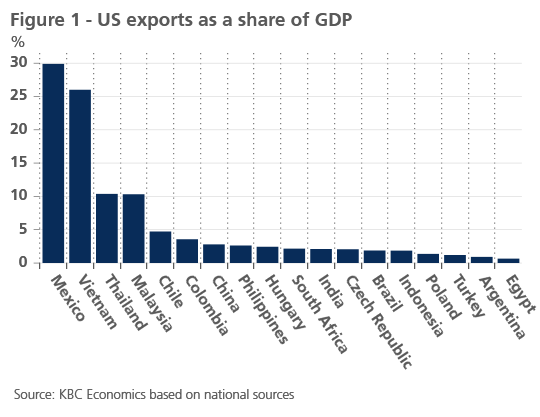
Many emerging markets have economies that are highly trade dependent. In Vietnam, exports account for more than 80% of GDP while Malaysia is not far behind at 78% of GDP. For other major emerging markets, export to GDP ratios range from 36% in Mexico, to 11% in India. More important in the context of a US-led trade war, however, is direct exposure to trade with the US. Here, Mexico is clearly the most vulnerable, with the US accounting for more than 80% of total exports, while Vietnam and Colombia follow with the US accounting for 30% of total exports. But taken together, both Mexico and Vietnam sit in precarious positions, with US exports accounting for 30% and 26% of each country’s respective GDPs (figure 1). Thailand and Malaysia are highly exposed as well at just over 10% of GDP. Meanwhile, China, notably, has become less exposed to trade frictions with the US over the last decade, with US exports to GDP declining from 7% in 2006 to 2.8% in 2024.
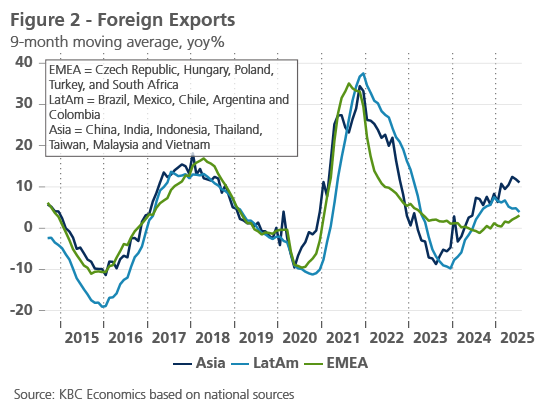
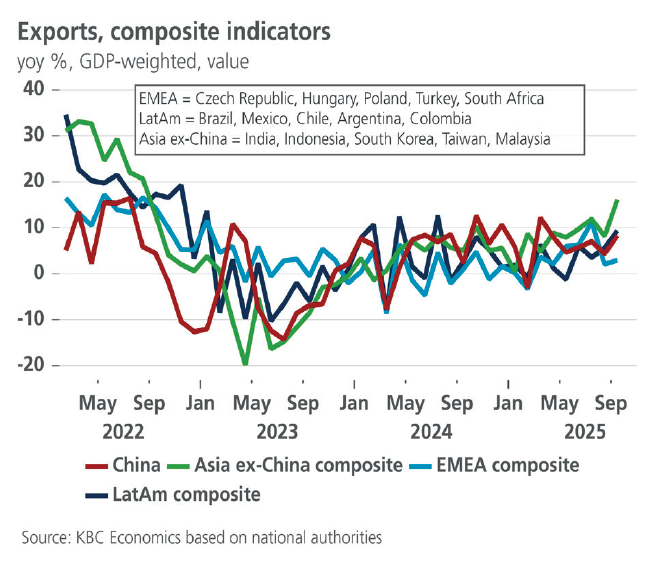
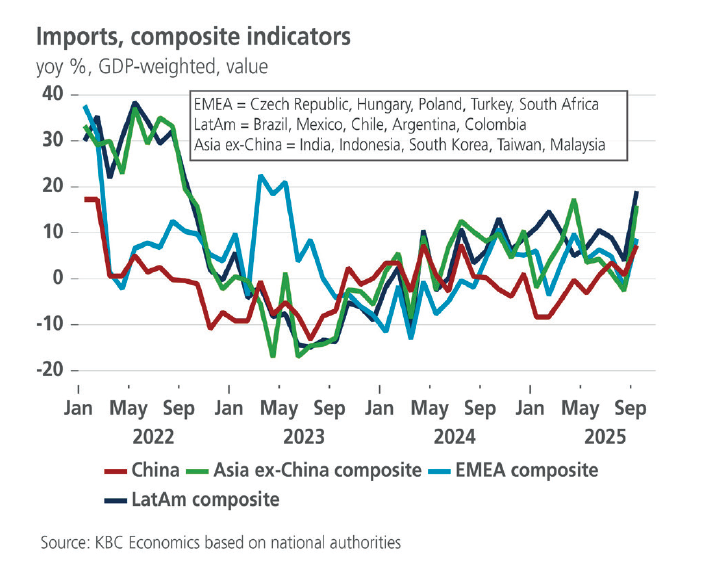
It is notable then, that as a whole, Latin America and emerging Asia have not seen a rapid deterioration in trade dynamics or GDP growth this year. In fact, export growth in Asia and Latin America is mostly up year-to-date relative to a year earlier (figure 2). And while the most recent IMF World Economic Outlook highlights an expected slowdown in the coming quarters, emerging market and developing economy GDP growth is expected to slow by only one basis point in 2025 (from 4.3% to 4.2%) and another 2 basis points in 2026 (to 4.0%). This is, in fact, an upgrade relative to the April 2025 WEO (released when uncertainty was at its peak) and not substantially different from the April 2024 WEO, before it was certain who would win the US presidential election.
Supportive factors
From a backwards looking perspective, contributing factors to EM resilience include the uneven and gradual roll out of tariff barriers, which were scaled back for many countries relative to what was initially announced in April. This left time for US importers to stockpile goods in the run up to the tariffs, resulting in a surge in US demand for external goods in the first half of the year. This temporary boost to growth will continue to fade in the coming quarters (with US total goods imports indeed surging 18% qoq in Q1 and contracting another 18% qoq in Q2).
Also backwards looking, the strong depreciation of the USD against its broad, trade weighed index between January and July 2025 (-8% peak to trough) helped contribute to easier financial conditions globally during that period of extreme uncertainty. This development was somewhat unexpected and unusual given the traditional safe-haven status of the USD, which tends to appreciate during risk-off periods. Though an appreciating USD would offset to some extent the increased tariff shock, the weaker dollar instead put less pressure on emerging market currencies and assets and avoided presenting central banks with the usual policy trade-off between supporting growth and supporting the local currency (or financial stability more generally) during periods of elevated volatility.
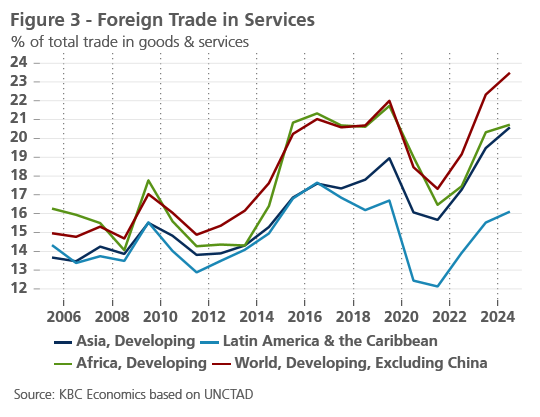
But there are other factors at play in the resilience story as well. A recent analysis by S&P highlights that a higher strategic importance of services trade (ICT, tourism, etc.) serves as a buffer for external shocks, in particular shocks to goods trade. Indeed, developing economies have seen a rise in the share of services in total trade over the past two decades (figure 3), with services being relatively more shielded from external shocks such as tariffs or physical supply chain disruptions. This appears to be less of a source of strength for Latin American economies, due to a long-standing dependence on commodities and macroeconomic volatility that deters investment in tradable service sectors.
Meanwhile, the IMF focuses on improved policy frameworks, particularly related to central bank policies, to explain increased emerging market resilience to risk-off shocks. In particular, the early and aggressive policy tightening of many emerging market central banks in the post-pandemic, high-inflation era improved credibility and likely helped anchor inflation expectations. However, the IMF finds that emerging market policymakers have been able to shift more generally toward inflation targeting and away from exchange rate fluctuation concerns in the post-crisis period, suggesting a longer-run improvement in emerging market monetary policy frameworks. While fiscal policy and macroprudential policy also contribute to macroeconomic stability, the IMF notes that progress in these areas has varied more between countries.
Caution ahead
Nevertheless, the path ahead for emerging markets remains rocky at best. An expected further slowdown of growth in the US and China, together with the further pass through of tariff shocks as importers work through inventories and prices begin to adjust mean the external environment is set to become less growth supportive going forward. While re-routing trade and increased bilateral or multilateral trade deals can support emerging markets’ export performance, such adjustments will take time and can lead to both winners and losers. Also worth noting is the sharp decline in foreign aid from the US which, though a more pronounced loss for less developed and frontier economies, can weigh on regional growth developments as well. Furthermore, emerging market central banks generally remain cautious in their policy easing, especially given outstanding uncertainties related to the global disinflation trend, while fiscal space is generally limited.
China
The economic outlook for China is little changed given a lack of decisive data that move the needle one way or the other. The economy continues to muddle through, with a good chance of GDP growth reaching the government’s 5% target for 2025, though risks remain to the downside. In August, momentum in industrial production and retail trade stabilised somewhat at 0.37% month-over-month and 0.17% month-over-month, respectively. However, in year-over-year terms, both series dipped lower in August (5.2% and 3.4%). Other hard data also point to sluggish growth. Credit growth (total social financing) remains overwhelmingly supported by government bond issuance while fixed asset investment, which fell to 0.5% year-to-date year-over-year in August, is kept positive only by state-owned enterprises, together suggesting that the private sector is still cautious and deleveraging.
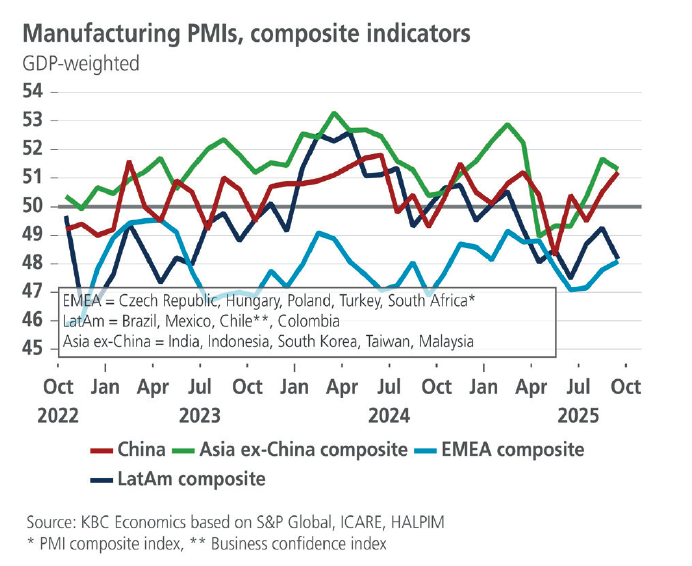
One brighter signal for the Chinese economy of late has been an improvement in business sentiment, particularly the S&P PMIs for manufacturing and services (51.2 and 52.9, respectively in September, where anything above 50 represents expansion). Meanwhile, external trade holds up well despite the higher tariffs imposed by the US, with total exports growing 8.3% year-over-year in September. Though exports to the US have declined markedly (-27% year-over-year), the decline has been offset by a substantial increase in exports to other regions.
Trade tensions remain an important risk, however, with significant uncertainty surrounding an expected meeting between President Xi and President Trump later this month. China’s more stringent export controls recently imposed on rare earth minerals, and a threat by Trump to increase tariffs on Chinese exports to 100%, are, at least in part, strategies to gain leverage for negotiations ahead of the meeting, but they do raise the risk of the US-China trade conflict once again spiralling into an avalanche of tit-for-tat measures.
Chinese leaders will also meet internally to prepare the next five-year plan for China, though details on the country’s long-term strategy will likely not be released until March 2026. For now, we maintain our forecast of 5.0% real GDP growth in 2025 and 4.4% growth in 2026. Inflation remains bogged down by deflationary impulses and is expected to average 0.0% in 2025 and 1.0% in 2026.
India
India’s economy has remained resilient at the beginning of the year, registering only a moderate quarterly slowdown from Q1 2025 to Q2 2025 (the latter being the start of the fiscal year by which India measure’s it’s growth). Real GDP still grew 1.84% qoq in Q2, supported by private consumption and investment and a good monsoon season for agriculture. In yoy terms, growth accelerated in Q2 2025 from 7.4% to 7.8%. Many of these supportive factors are expected to continue going forward while the external environment is likely to become more complicated. Exports to the US account for 18% of India’s total exports, and 2% of India’s GDP. But the country has been subject to a 50% tariff rate by the US, half of which was due to the country’s continued purchase of Russian oil, and half due to a failure to negotiate a different rate after ‘Liberation Day’. There remains significant uncertainty over whether these tariff rates will prevail, however, especially if there are commitments from India to stop purchasing Russian oil.
Meanwhile, on the inflation front, food price disinflation (and in recent months even deflation) has brought the headline inflation figure in India down from 6.2% yoy in October 2024 to only 1.5% in September. Core inflation, however, has remained steadier, ticking up slightly to 4.5% yoy in September, which is just above the central bank’s 4% target. Given uncertainties related to trade dynamics, however, the central bank (RBI) has been on hold since June, with the policy rate at 5.5% (after cutting 100 bps in the first half of the year). We expect the RBI to remain on hold in the medium term.
Latin America
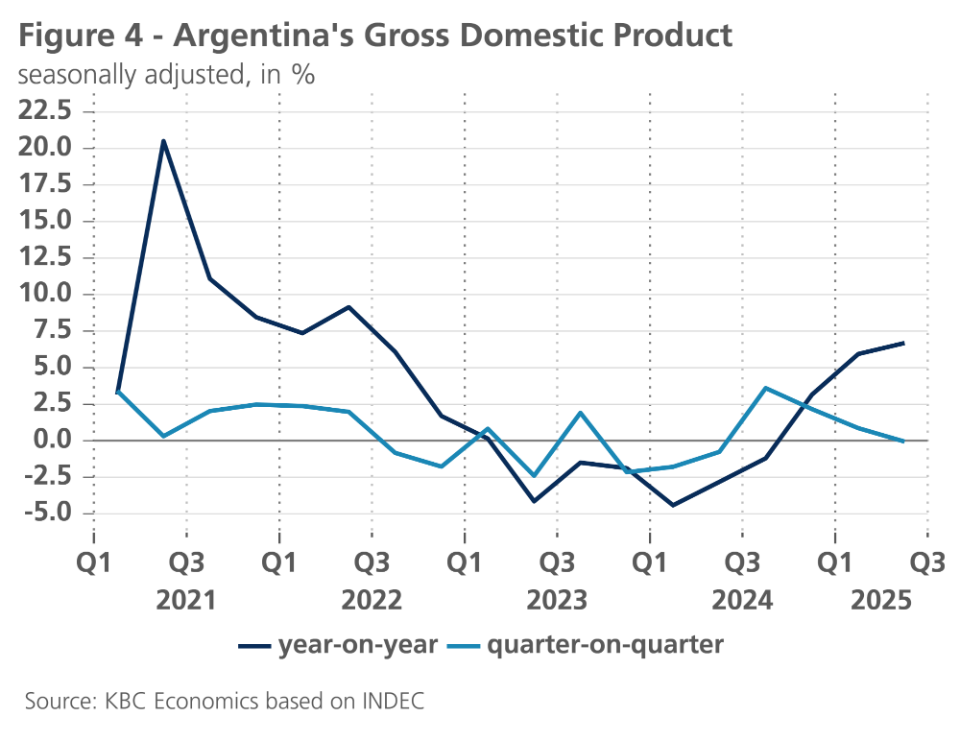
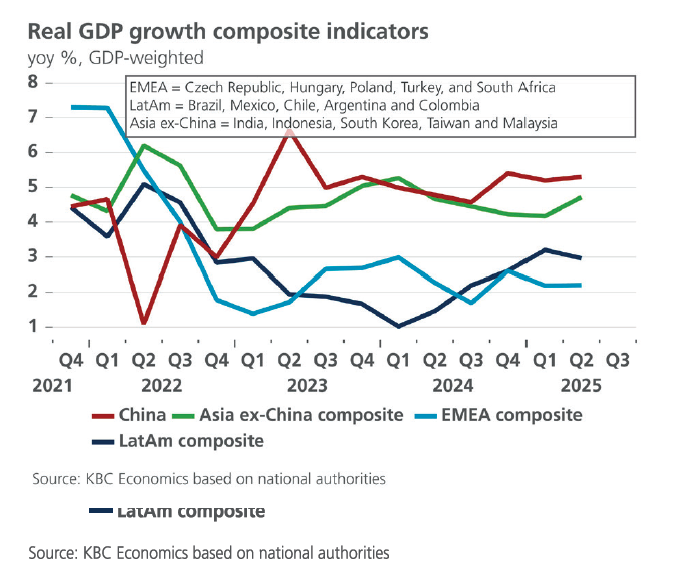
When it comes to the Latin American region, most eyes are currently on Argentina. The upcoming national midterm elections (October 26) will be essential for the future of President Milei’s austerity program and investors are weary about his party’s electoral odds. The president is facing increasing backlash from the population for his austerity agenda as economic growth is slowing (see figure 4). Milei’s strategy of using a strong peso to bring down inflation is difficult to reconcile with economic growth, especially for a commodity and export-dominated country like Argentina. The corruption scandal that involves the Milei’s sister and chief of staff adds further oil to the fire. This scandal is especially damaging for Milei as he has vowed to tackle widespread corruption in Argentina.
An unexpected landslide defeat for Milei’s libertarian party in the local elections in Buenos Aires province at the beginning of September triggered a large run on the peso. This was further fueled by fact that the opposition-dominated Congress recently overturned the president’s vetoes against several spending bills, a move that will likely push the fiscal balance back into deficit next year and that threatens the IMF program. The selloff resulted in the currency hitting the bottom of its exchange rate band. This prompted the central bank to step in to defend the band by digging into its foreign currency reserves. Many investors now fear that Argentina will not be able to keep the band scheme in place. The announcement that the US would provide Argentina a lifeline in the form of a 20 billion USD currency swap line as part of a rescue package provided some temporary respite for the peso but investor unease soon returned as fundamental economic problems persist. For one, Argentina still lacks full access to international financial markets and next year it needs fresh funding to pay back maturing loans. President Trump recently announced that the funding deal would be dependent on Milei’s party winning the election at the end of October, adding another uncertainty factor to the mix. It is currently unclear what concessions Argentina, beyond staying on its austerity track, made as part of its agreement with the US.
Most international institutions have downgraded their GDP outlook for Argentina in the course of 2025. After a contraction by 1.3% in 2024, GDP growth in Argentina is now expected to rebound to 4.5% in 2025 and 4.0% in 2026. Inflation is forecast to continue its decline but remain elevated at 41.3% in 2025 and 16.4% in 2026. Uncertainty around the GDP and inflation outlook is high, with financial stability concerns and electoral challenges casting a shadow over the country’s economic outlook.
Mexico, the Latin American country with the largest trade dependence on the US, has announced its own slew of tariffs up to 50% on countries with which it has no trade agreement, like China, South Korea and India. The tariffs are mainly aimed at appeasing Trump’s concerns that Mexico is a passthrough country to the US for cheap (Chinese) goods. The high US trade tariffs have come on top of an already declining economic momentum in Mexico caused by fiscal consolidation measures and largescale institutional reforms (including to the judiciary, regulators and the electoral process) that have dented investor and consumer confidence. In the course of 2025, the central bank has cut its benchmark interest rate 6 times to 7.5%, the lowest level since May 2022. It also indicated that further easing was possible given ongoing concerns about global trade tensions and sluggish economic growth. GDP growth is expected to be moderate at 1.0% in 2025, followed by an increase to 1.5% in 2026. Sticky inflation, and even rising inflation figures of late, will prompt the central bank to be cautious in its easing decisions going forward. For now, we forecast a 3.9% inflation rate in 2025 and a more moderate 3.3% in 2026.
Unlike its regional peers, the Brazilian central bank had been raising interest rates until July 2025, when it decided to halt its rate hiking cycle at 15%. While the central bank has made progress in bringing inflation closer to target, it still faces a still tight labour market. Compared to other Latin American countries, Brazil is relatively insulated from the effects of US tariffs. The strengthening of Brazil's real currency and sticky inflation expectations are additional arguments to keep a restrictive stance for an extended period. Once inflation (expectations) come back to the central bank’s target, monetary easing will start but that is unlikely to happen this year. We expect GDP growth to slow from 3.4% in 2024 to 2.2% in 2025 and 1.6% in 2026 on the back of the tighter financial conditions. For inflation, we see an increase to 5.1% in 2025, followed by a moderation to 4.4% in 2026.
The longer-term growth outlook in the Latin American region has one important card up its sleeve: the EU-Mercosur trade agreement. If ratified, the EU-Mercosur trade agreement could boost economic growth in Mercosur-countries Argentina and Brazil in the coming years. On 3 September 2025, the EU sent the final text of the EU-Mercosur trade agreement to the European Parliament and the EU member states. This paves the way for the crucial ratification stage, one that the EC is trying to fast-track by splitting the trade pillar of the deal from the political part. As such, the ‘interim’ trade part of the deal would only require a qualified majority in the European Council and a majority in the European Parliament. This bypassing of veto and voting rights of individual member states is highly controversial and goes against the EC negotiation mandate for the EU-Mercosur deal. This paves the way for potential legal challenges going forward.
The EU also recently published its proposal for the EU-Mexico modernised Global Agreement (MGA), which is an update of the EU-Mexico Economic Partnership, Political Coordination and Cooperation Agreement that dates back to the year 2000. The updated agreement aims to bring the existing bilateral framework up-to-date with two decades of economic, political, and technological developments and it includes the elimination of virtually all tariffs on agricultural products, expanded access to public procurement procedures and the opening of trade in services (financial services, transport, e-commerce, telecom, etc.). The deal also goes beyond economics, namely by embedding cooperation and commitments around the protection of climate and labour rights and through measures to prevent and combat corruption.
CEE
In recent months, the Central and Eastern European (CEE) region continued to experience intensified policy and political divergence. Czechia achieved significant disinflation but simultaneously pivoted politically towards Euroscepticism following the October election. Slovakia adopted an aggressive, contractionary fiscal consolidation package designed to curb its soaring deficit. Hungary continued to maintain a restrictive monetary stance to counteract structural fiscal drag. In stark institutional contrast, Bulgaria cemented its trajectory toward Euro adoption in January 2026, providing a robust anchor for long-term credibility despite grappling with strong domestic inflationary pressure. For more details on the region, see the KBC Economic Perspectives.
South Africa
South Africa’s real GDP growth accelerated in the second quarter to 0.83% qoq from 0.11% previously, bringing the yoy growth rate to 1.05%. This strength was broad based apart from investment. On the production side, manufacturing output recovered, growing 3.58% qoq following a contraction in Q1 (-1.5%). Mining production also accelerated in the second quarter, from 0.45% qoq to 4.3% qoq. However, a contraction in August (-1.16% mom) points to a slowdown in momentum going forward. Meanwhile, from an expenditure perspective, household consumption accelerated in Q2 from 0.52% qoq to 0.84% qoq. The positive GDP report led the central bank (SARB) to revise up its forecast for 2025 real GDP growth from 0.9% to 1.2% (closer in line with our unchanged forecast of 1.1%). However, the SARB notes that there are many risks on the horizon, including a weaker export environment and still weak investment dynamics.
Despite these risks to the growth outlook, and despite headline (3.3% yoy) and core inflation (3.1% yoy) being within the SARB’s inflation target range of 3-6%, the SARB left its policy rate unchanged in September at 7%. However, base effects are expected to lift inflation over the next several months. Furthermore, the SARB has noted a shifting preference towards the bottom of the target range rather than the middle, requiring a somewhat tighter policy stance over the medium term (with a new inflation target still to be formalised). Given these considerations, we anticipate the SARB will remain on hold through this year and the beginning of next year, resuming its rate cutting cycle in Q2 2026 as base effects wane.
Tables & Figures

Outlook emerging market economies
Forecasts are those prevailing on 13 October 2025
| Real GDP growth (period average, in %) | Inflation (period average, in %) | ||||||
| 2024 | 2025 | 2026 | 2024 | 2025 | 2026 | ||
| BRICS | China | 5.0 | 5.0 | 4.4 | 0.2 | 0.0 | 1.0 |
| Brazil | 3.4 | 2.2 | 1.6 | 4.4 | 5.1 | 4.4 | |
| India* | 6.5 | 6.7 | 6.0 | 4.6 | 2.5 | 4.6 | |
| Russia | n/a | n/a | n/a | n/a | n/a | n/a | |
| South Africa | 0.5 | 1.1 | 1.3 | 4.4 | 3.3 | 3.9 | |
| Asia | Indonesia | 5.0 | 4.9 | 4.9 | 2.3 | 1.8 | 2.9 |
| Malaysia | 5.1 | 4.5 | 4.0 | 1.8 | 1.6 | 2.2 | |
| South Korea | 2.0 | 0.9 | 1.8 | 2.3 | 2.0 | 1.8 | |
| Taiwan | 4.8 | 3.7 | 2.1 | 2.2 | 1.7 | 1.6 | |
| Latin America | Argentina | -1.3 | 4.5 | 4.0 | 219.9 | 41.3 | 16.4 |
| Chile | 2.6 | 2.5 | 2.0 | 3.9 | 4.3 | 3.1 | |
| Mexico | 1.4 | 1.0 | 1.5 | 4.7 | 3.9 | 3.3 | |
| EMEA | Czech Republic | 1.1 | 2.2 | 1.9 | 2.7 | 2.4 | 2.2 |
| Hungary | 0.6 | 0.5 | 2.4 | 3.7 | 4.5 | 4.0 | |
| Poland | 2.9 | 3.2 | 3.0 | 3.6 | 3.6 | 3.0 | |
| Turkey | 3.3 | 3.2 | 3.3 | 58.5 | 34.1 | 23.1 | |
| * Real GDP growth measured over fiscal year from April-March | 13/10/25 | ||||||
| Source: Forecasts for 'BRICS' plus Turkey, Czech Republic, Hungary and Poland are KBC Economics' own forecasts. All others are IMF World Economic Outlook figures. | |||||||
| Policy rates, 10-year government bond yields (in %) and exchange rates (end of period) | ||||||
| 13/10/2025 | Q4 2025 | Q1 2026 | Q2 2026 | Q3 2026 | ||
| China | policy rate* | 1.40 | 1.30 | 1.20 | 1.10 | 1.10 |
| 10-year yield | 1.77 | 1.81 | 1.81 | 1.86 | 1.96 | |
| CNY per USD | 7.13 | 7.12 | 7.12 | 7.12 | 7.12 | |
| Brazil | policy rate | 15.00 | 15.00 | 14.75 | 14.25 | 13.75 |
| 10-year yield | 14.05 | 14.19 | 14.19 | 14.24 | 14.34 | |
| BRL per USD | 5.48 | 5.40 | 5.38 | 5.35 | 5.35 | |
| India | policy rate | 5.50 | 5.50 | 5.50 | 5.50 | 5.50 |
| 10-year yield | 6.52 | 6.66 | 6.66 | 6.71 | 6.81 | |
| INR per USD | 88.68 | 87.45 | 87.09 | 86.73 | 86.73 | |
| Russia | policy rate | - | - | - | - | - |
| 10-year yield | - | - | - | - | - | |
| RUB per USD | - | - | - | - | - | |
| South Africa | policy rate | 7.00 | 7.00 | 7.00 | 6.75 | 6.50 |
| 10-year yield | 9.10 | 9.24 | 9.24 | 9.29 | 9.39 | |
| ZAR per USD | 17.36 | 17.12 | 17.05 | 16.98 | 16.98 | |
| Turkey | policy rate | 43.00 | 36.00 | 32.00 | 27.00 | 24.50 |
| 10-year yield | 29.16 | 28.75 | 28.00 | 26.00 | 24.00 | |
| TRY per USD | 41.80 | 43.54 | 45.75 | 47.74 | 49.75 | |
| Czech Republic | policy rate | 3.50 | 3.50 | 3.50 | 3.50 | 3.50 |
| 10-year yield | 4.37 | 4.40 | 4.30 | 4.30 | 4.30 | |
| CZK per EUR | 1.74 | 1.65 | 1.54 | 1.53 | 1.52 | |
| Hungary | policy rate* | 6.50 | 6.50 | 6.25 | 6.25 | 6.00 |
| 10-year yield | 6.85 | 6.85 | 6.80 | 6.60 | 6.50 | |
| HUF per EUR | 392.38 | 390.00 | 392.00 | 395.00 | 399.00 | |
| Poland | policy rate | 4.50 | 4.50 | 4.00 | 4.00 | 4.00 |
| 10-year yield | 5.41 | 5.20 | 4.90 | 4.80 | 4.80 | |
| PLN per EUR | 4.26 | 4.27 | 4.25 | 4.23 | 4.23 | |
| *China's policy rate refers to 7-day reverse repo rate, Hungary's policy rate refers to the base rate | ||||||
| There are currently no forecasts provided for Russia | ||||||
Composite Growth Indicators


